Problem identification
The core aim for designing an OSA platform is to create awareness of a given situation which is taking place in real time or to investigate historical events, which can be analysed to execute a response. Situational awareness paints a detailed picture of an event and gives the user an ability to process multiple sources of information and execute a calculated action in response.
Example OSA information sources
This information shouldn’t be interpreted as 100% accurate; a layer of balanced judgement should be implemented. Human insight and discretion must be applied to any decisions or instructions; this means every situational awareness is individual and potentially different. Having the advantage to be aware of what is happening at a given location, and having the power to source multiple data sets gives the user extreme power to make analytical decisions.
• Tabulated data (Any data which has a systematic structure)
• Satellite derived data
• Ground based communications
• Autonomous vehicle sensor feed (Robotic devices, drone, and small aircraft)
• Social media feeds – Twitter
• Network based communications – Internet, Cellular networks • Military communication
• Police Communication
• Government Database
Situation awareness helps users make better decisions by providing a clear understanding of the current state. It allows people to evaluate options and choose the most appropriate course of action.
Creating a Visual Language
Wave UI Design (Video Wall Specific)
The proposed idea will consist of two information streams, the first information layer will display Algorithm performance and the second layer will display information cards which allow the user to view important information at a granular level.
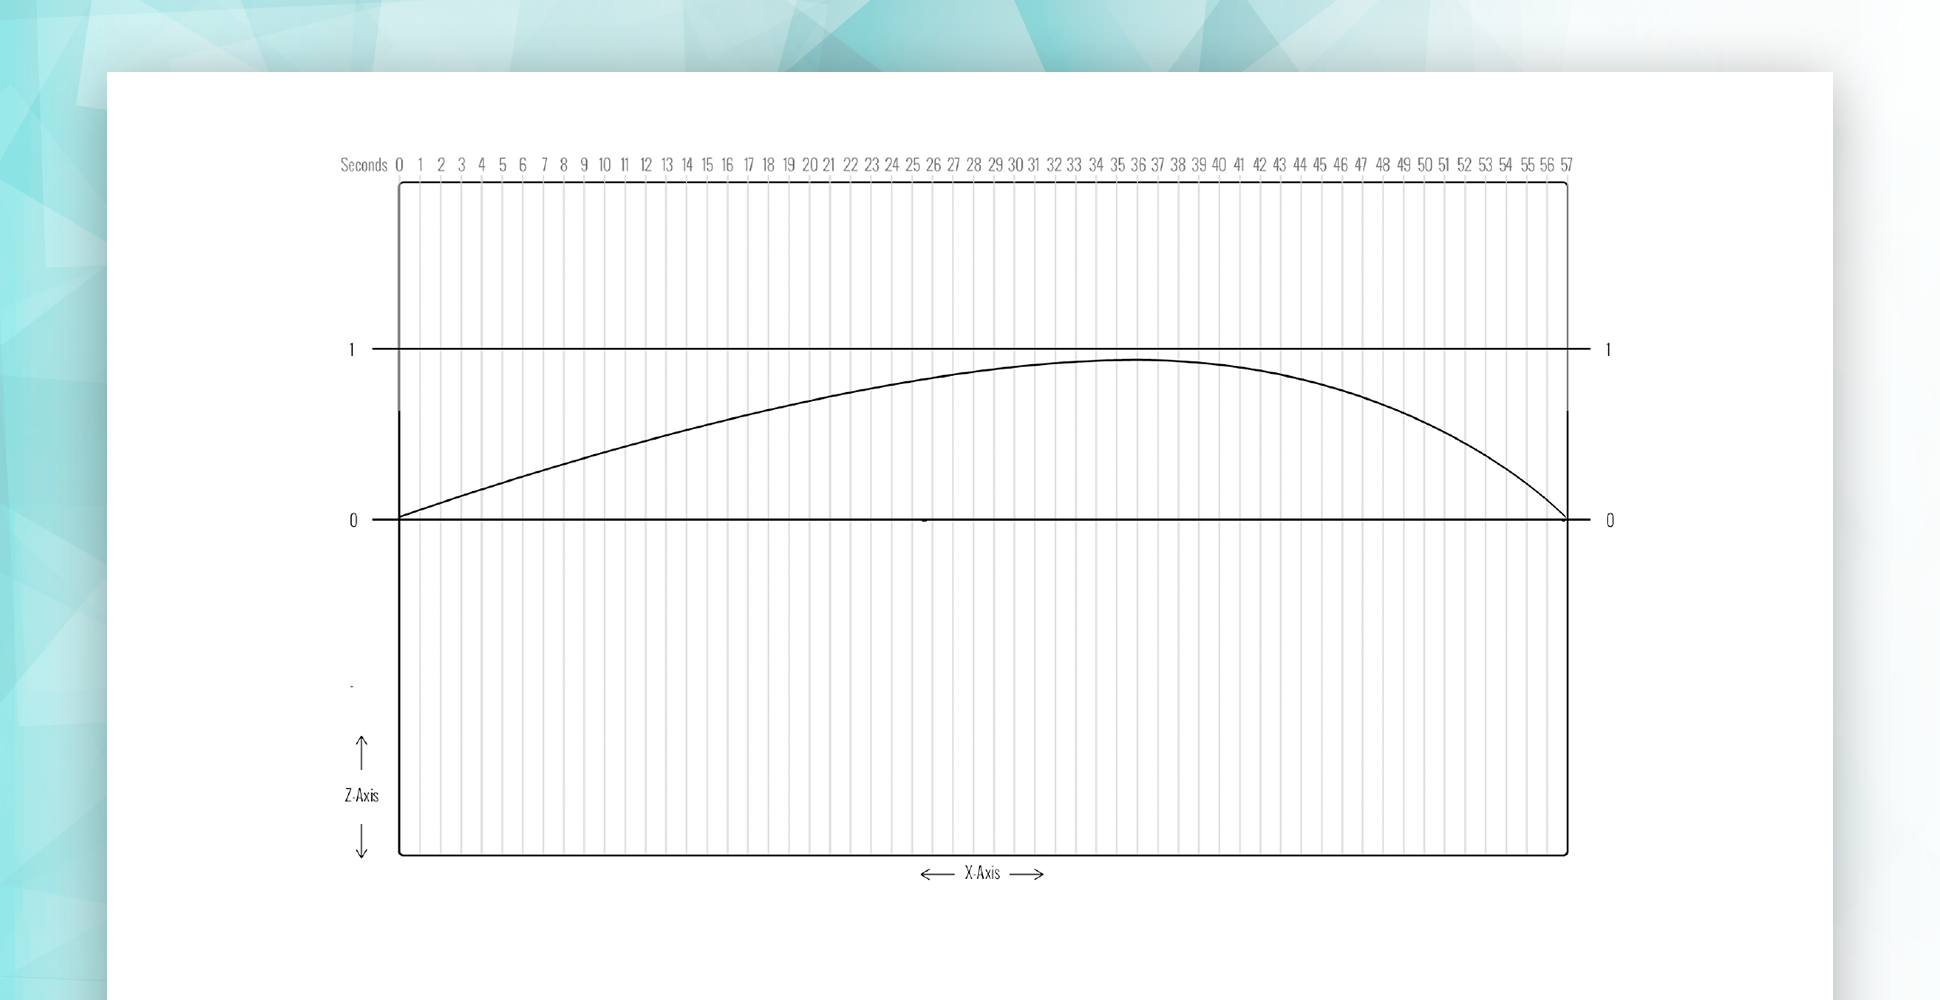
First information abstraction layer – The Wave
The core design philosophy behind the Wave UI proposal for the video wall is to passively communicate information to the user so they can create a picture of how a situation is unfolding in real time. The wave will passively communicate algorithmic performance to the user by showing high output as a large wave and low output with smaller waves. The current algorithm performance will be displayed in real time, and the rate of output the algorithm calculates will be visualised as wave oscillation. The performance will be determined by data input into the algorithm and the time taken to calculate the output, so the algorithm throughput rate will be analysed. This will give the user an insight into how busy the information channels are and current activity levels, to increase situational awareness.
• Y‐Axis ‐ Rate of algorithm output
• X‐Axis ‐ Time (Seconds)
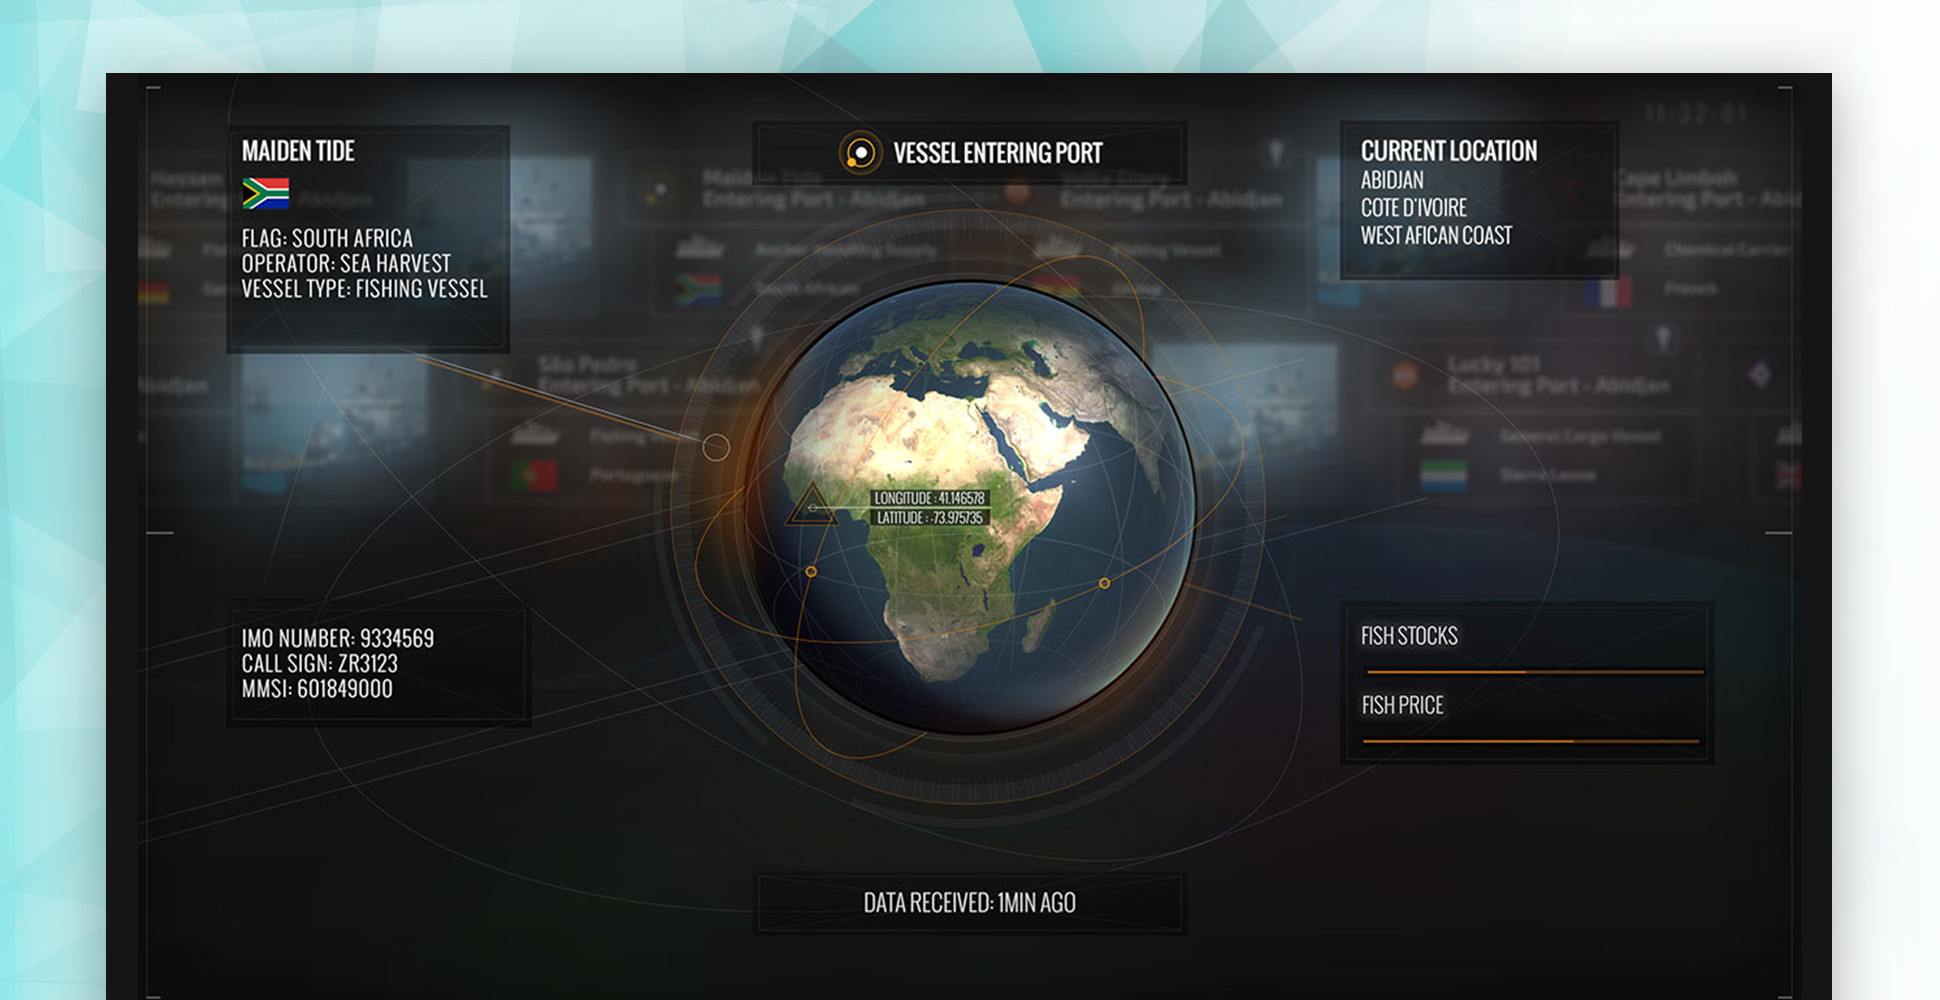
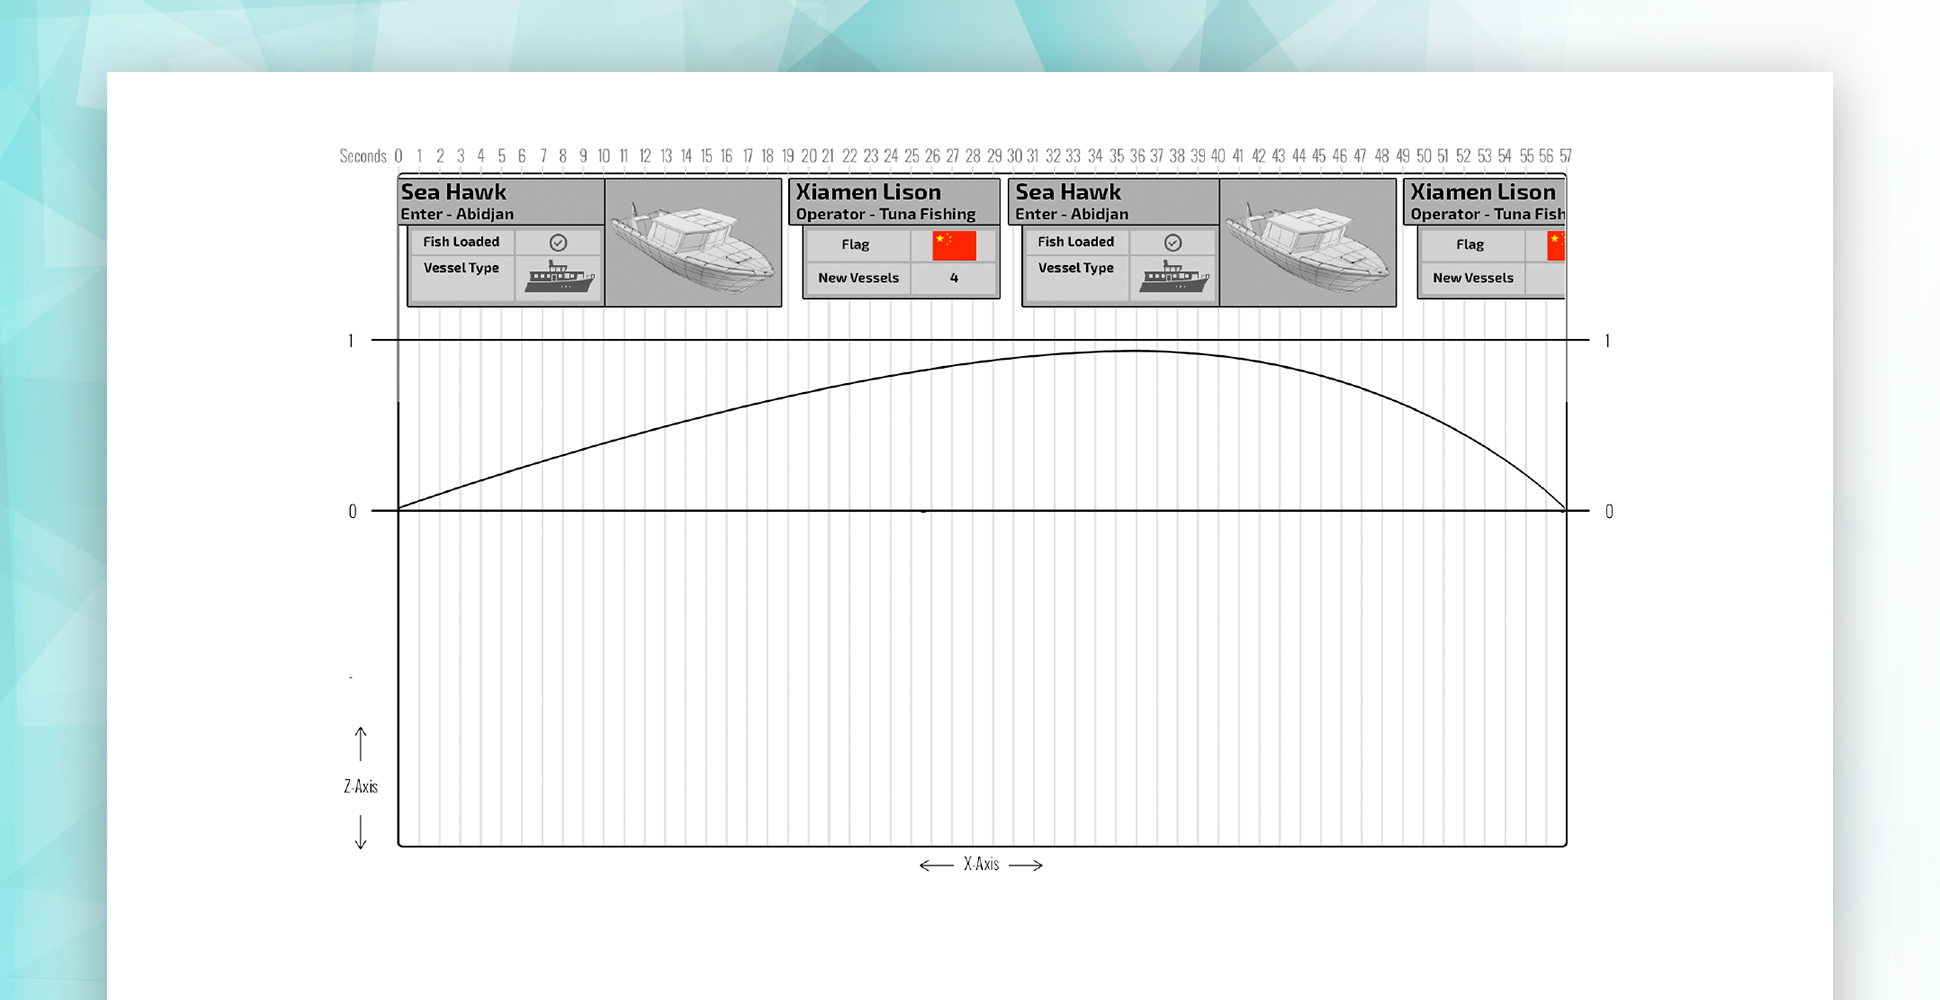
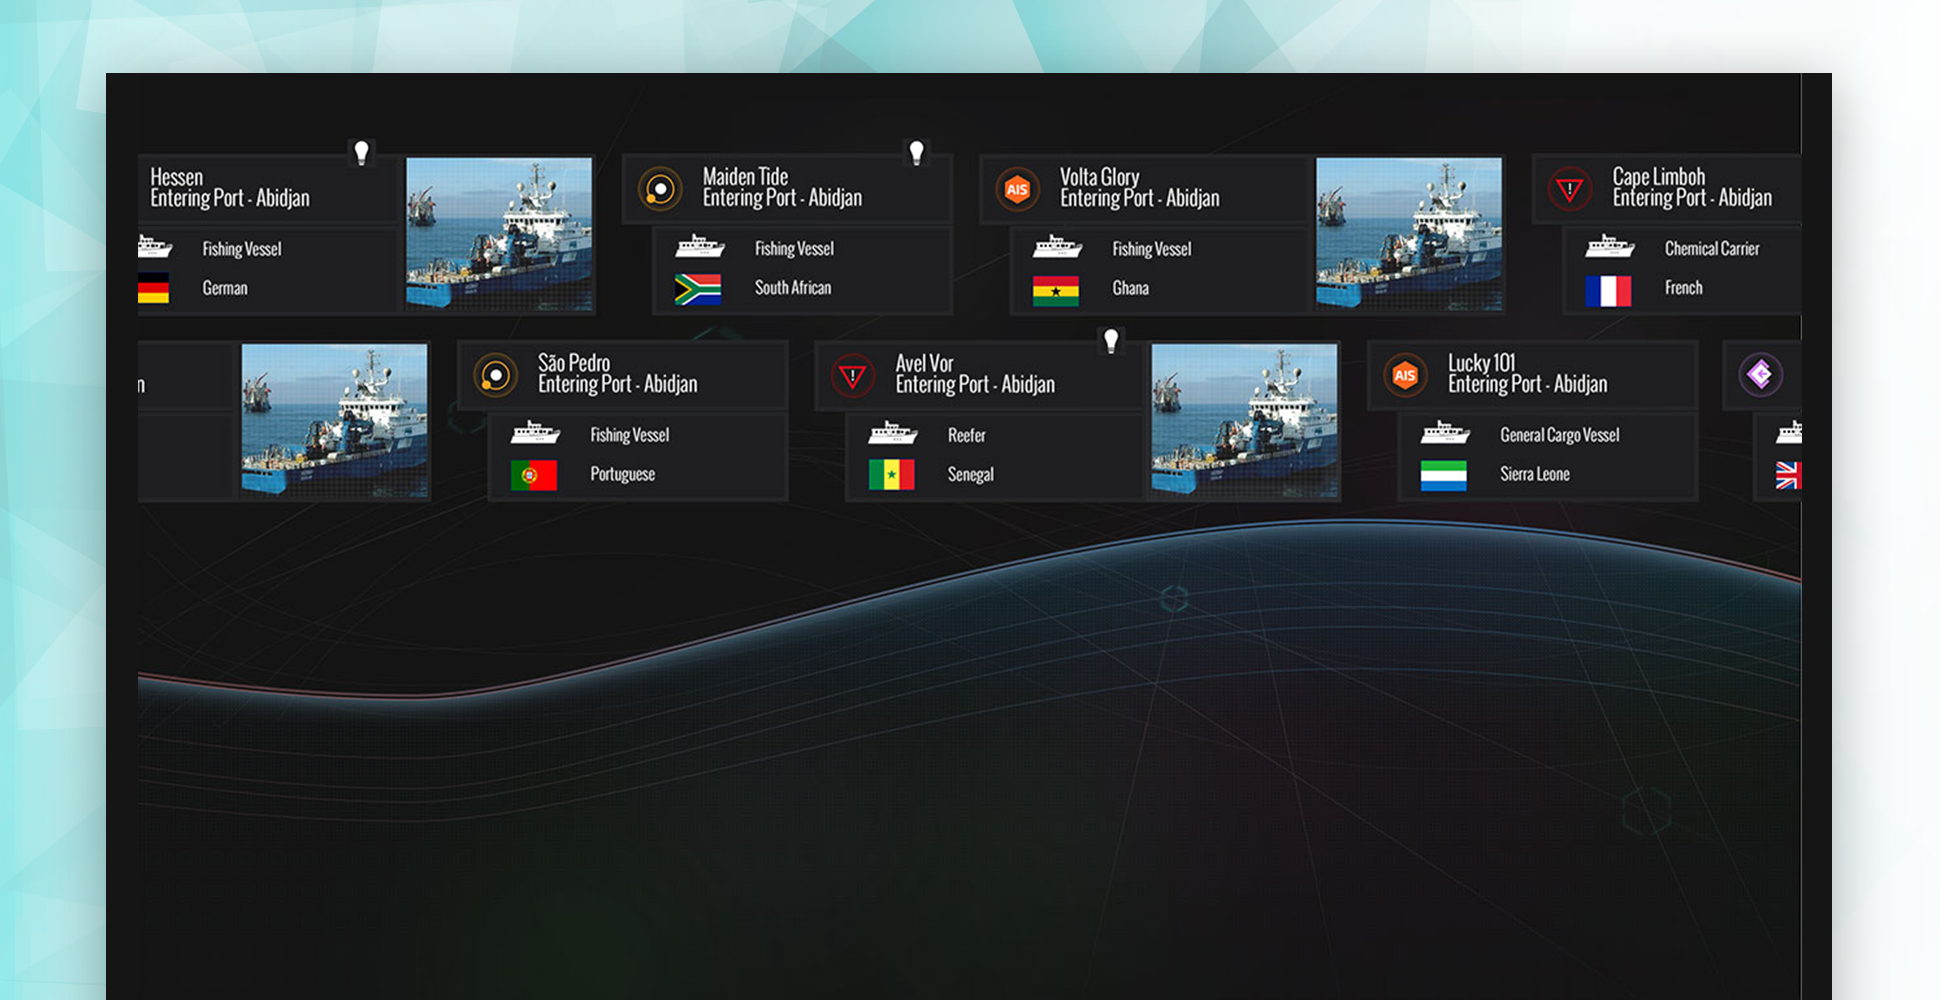
Second Information Abstraction Layer – The Ticker Tape
The design will also have a ticker tape at the top of the screen, so it is clearly visible on a video wall. This will contain live information about a situation which is occurring; the information will be context sensitive. So the user has the power to select the subject types they wish to monitor, so a maritime OSA platform may want to watch a specific port, and any vessels entering this port will be flagged and added to the ticker. The ticker will stream the information card from the left side of the screen to the right, giving a constant flow of information to the user.
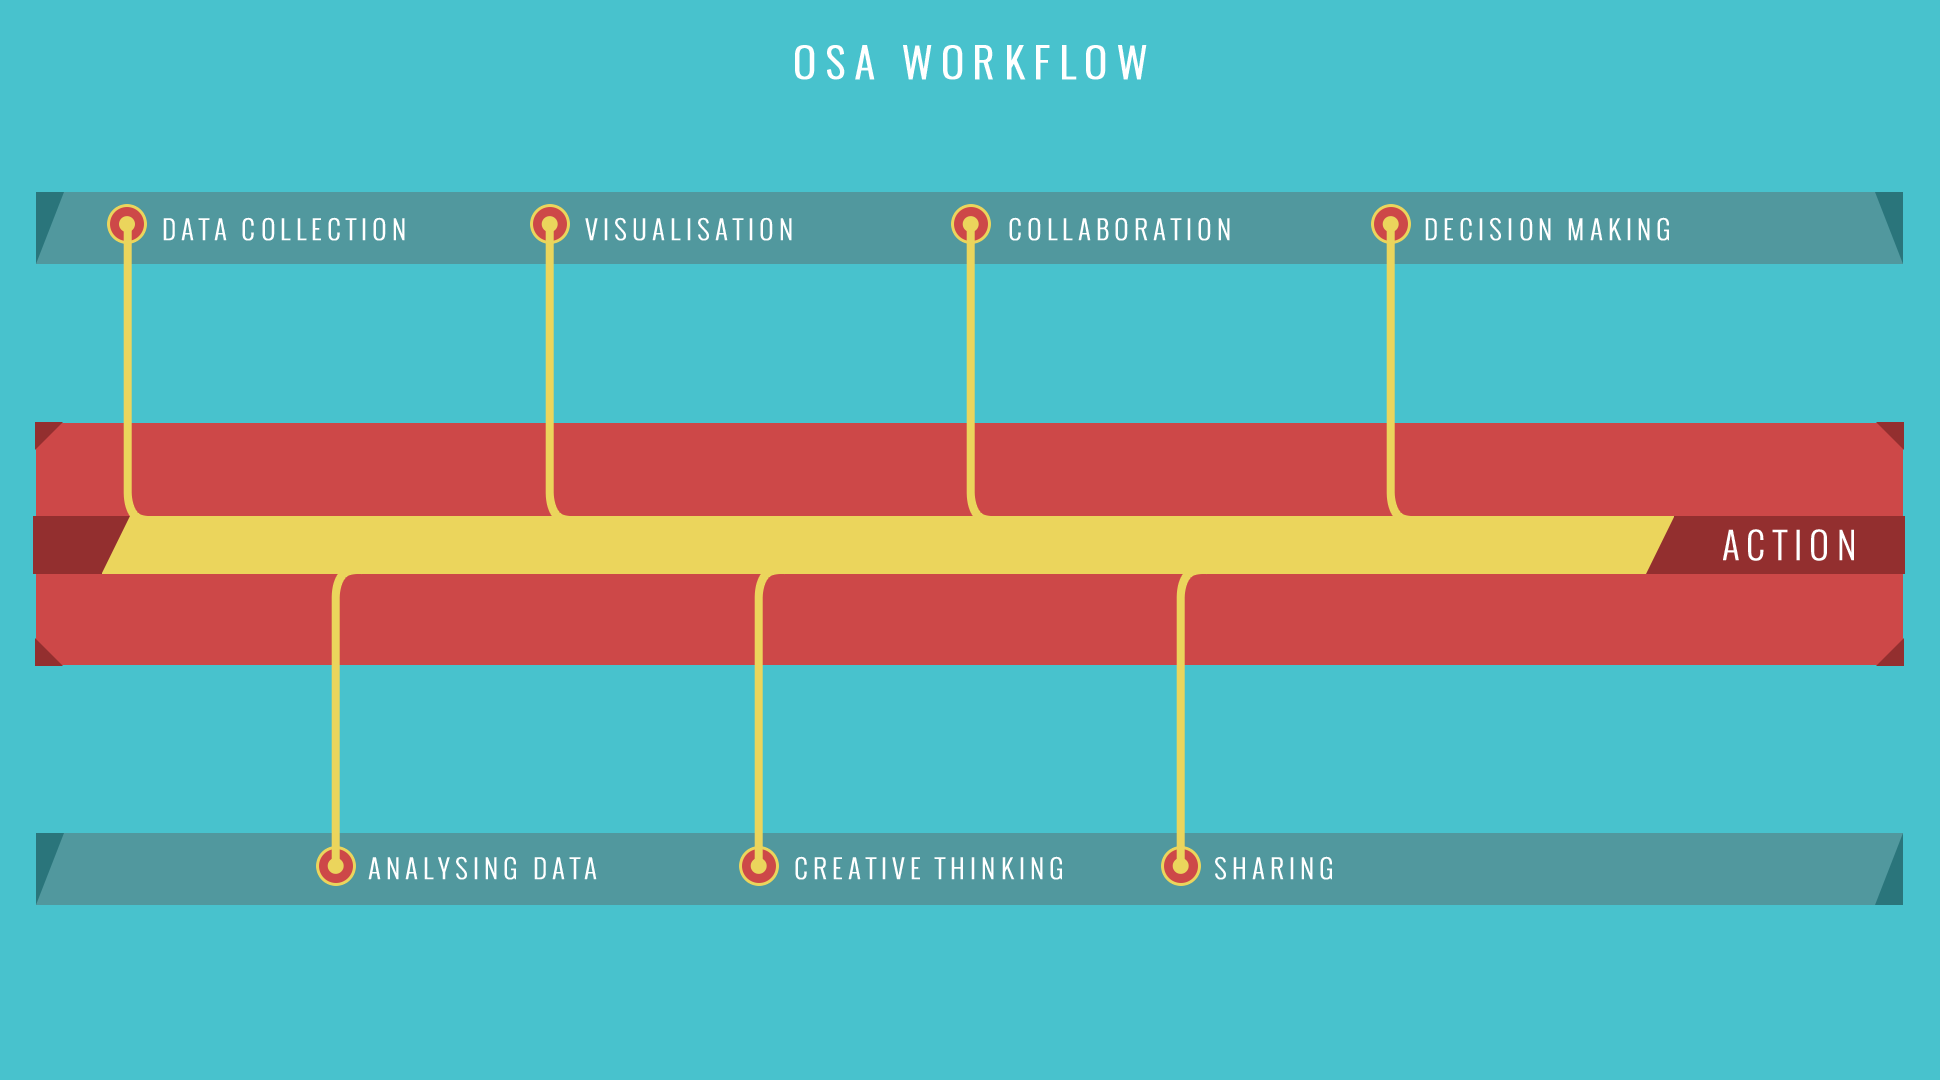
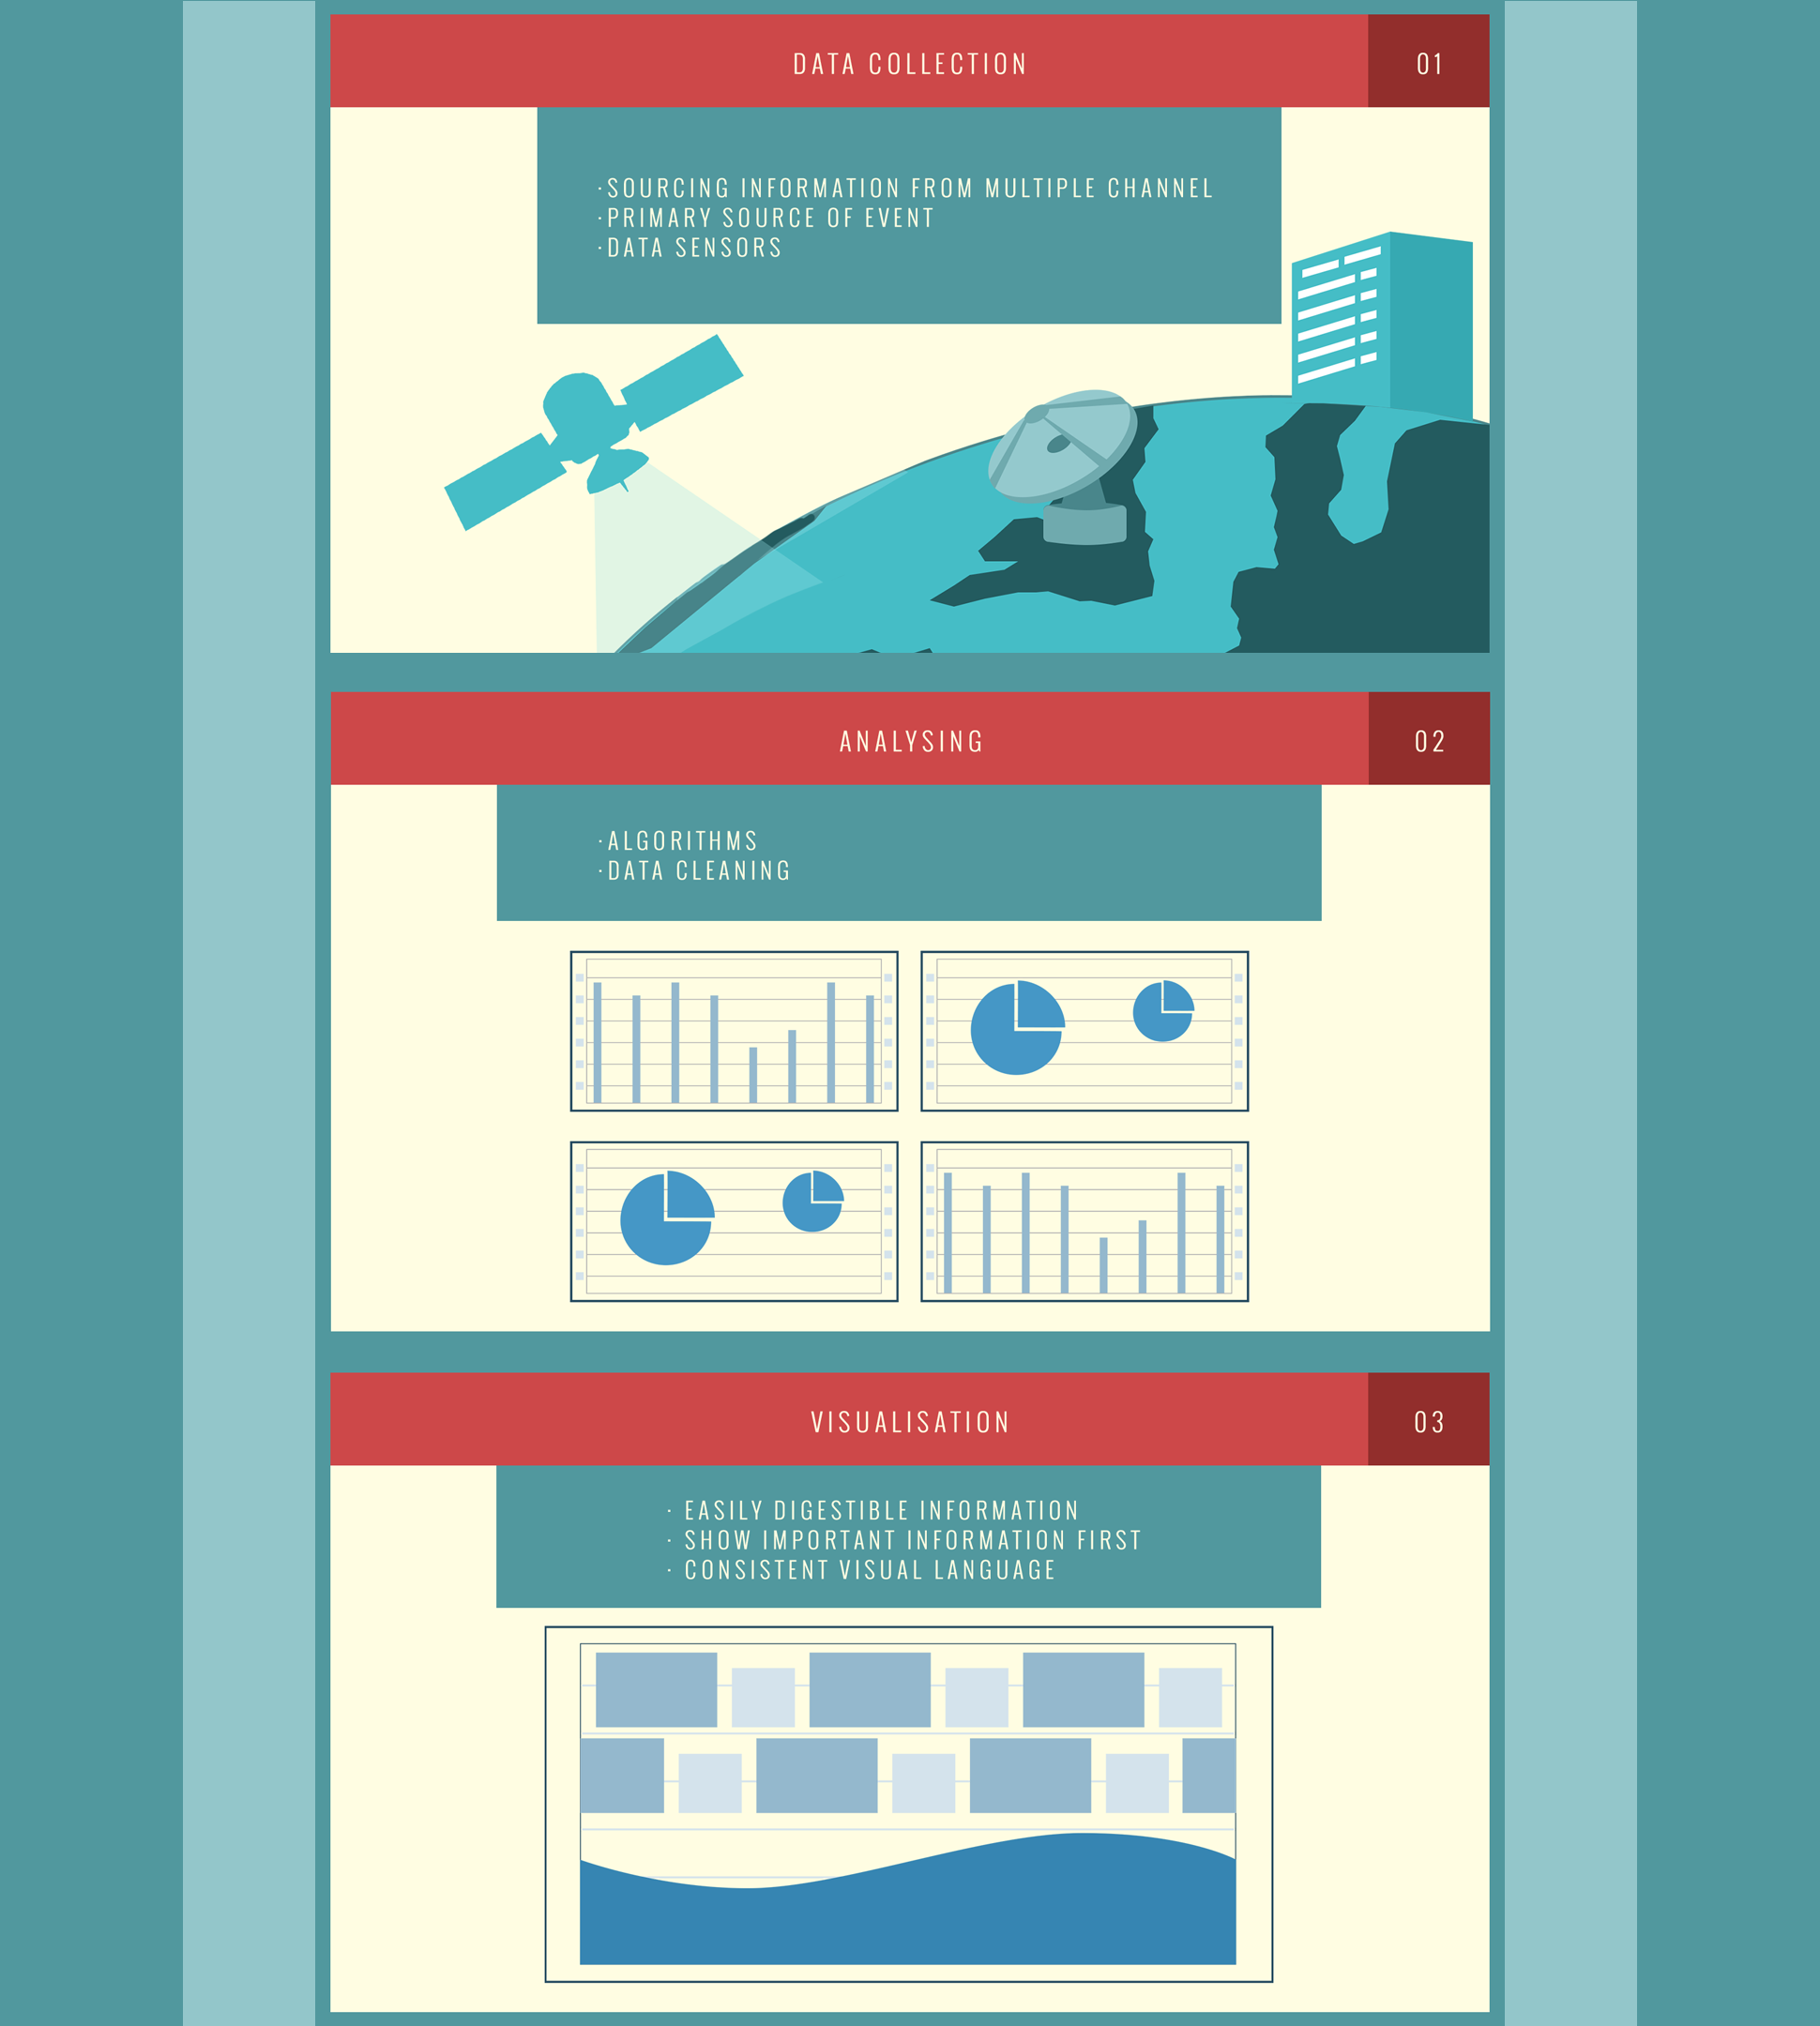
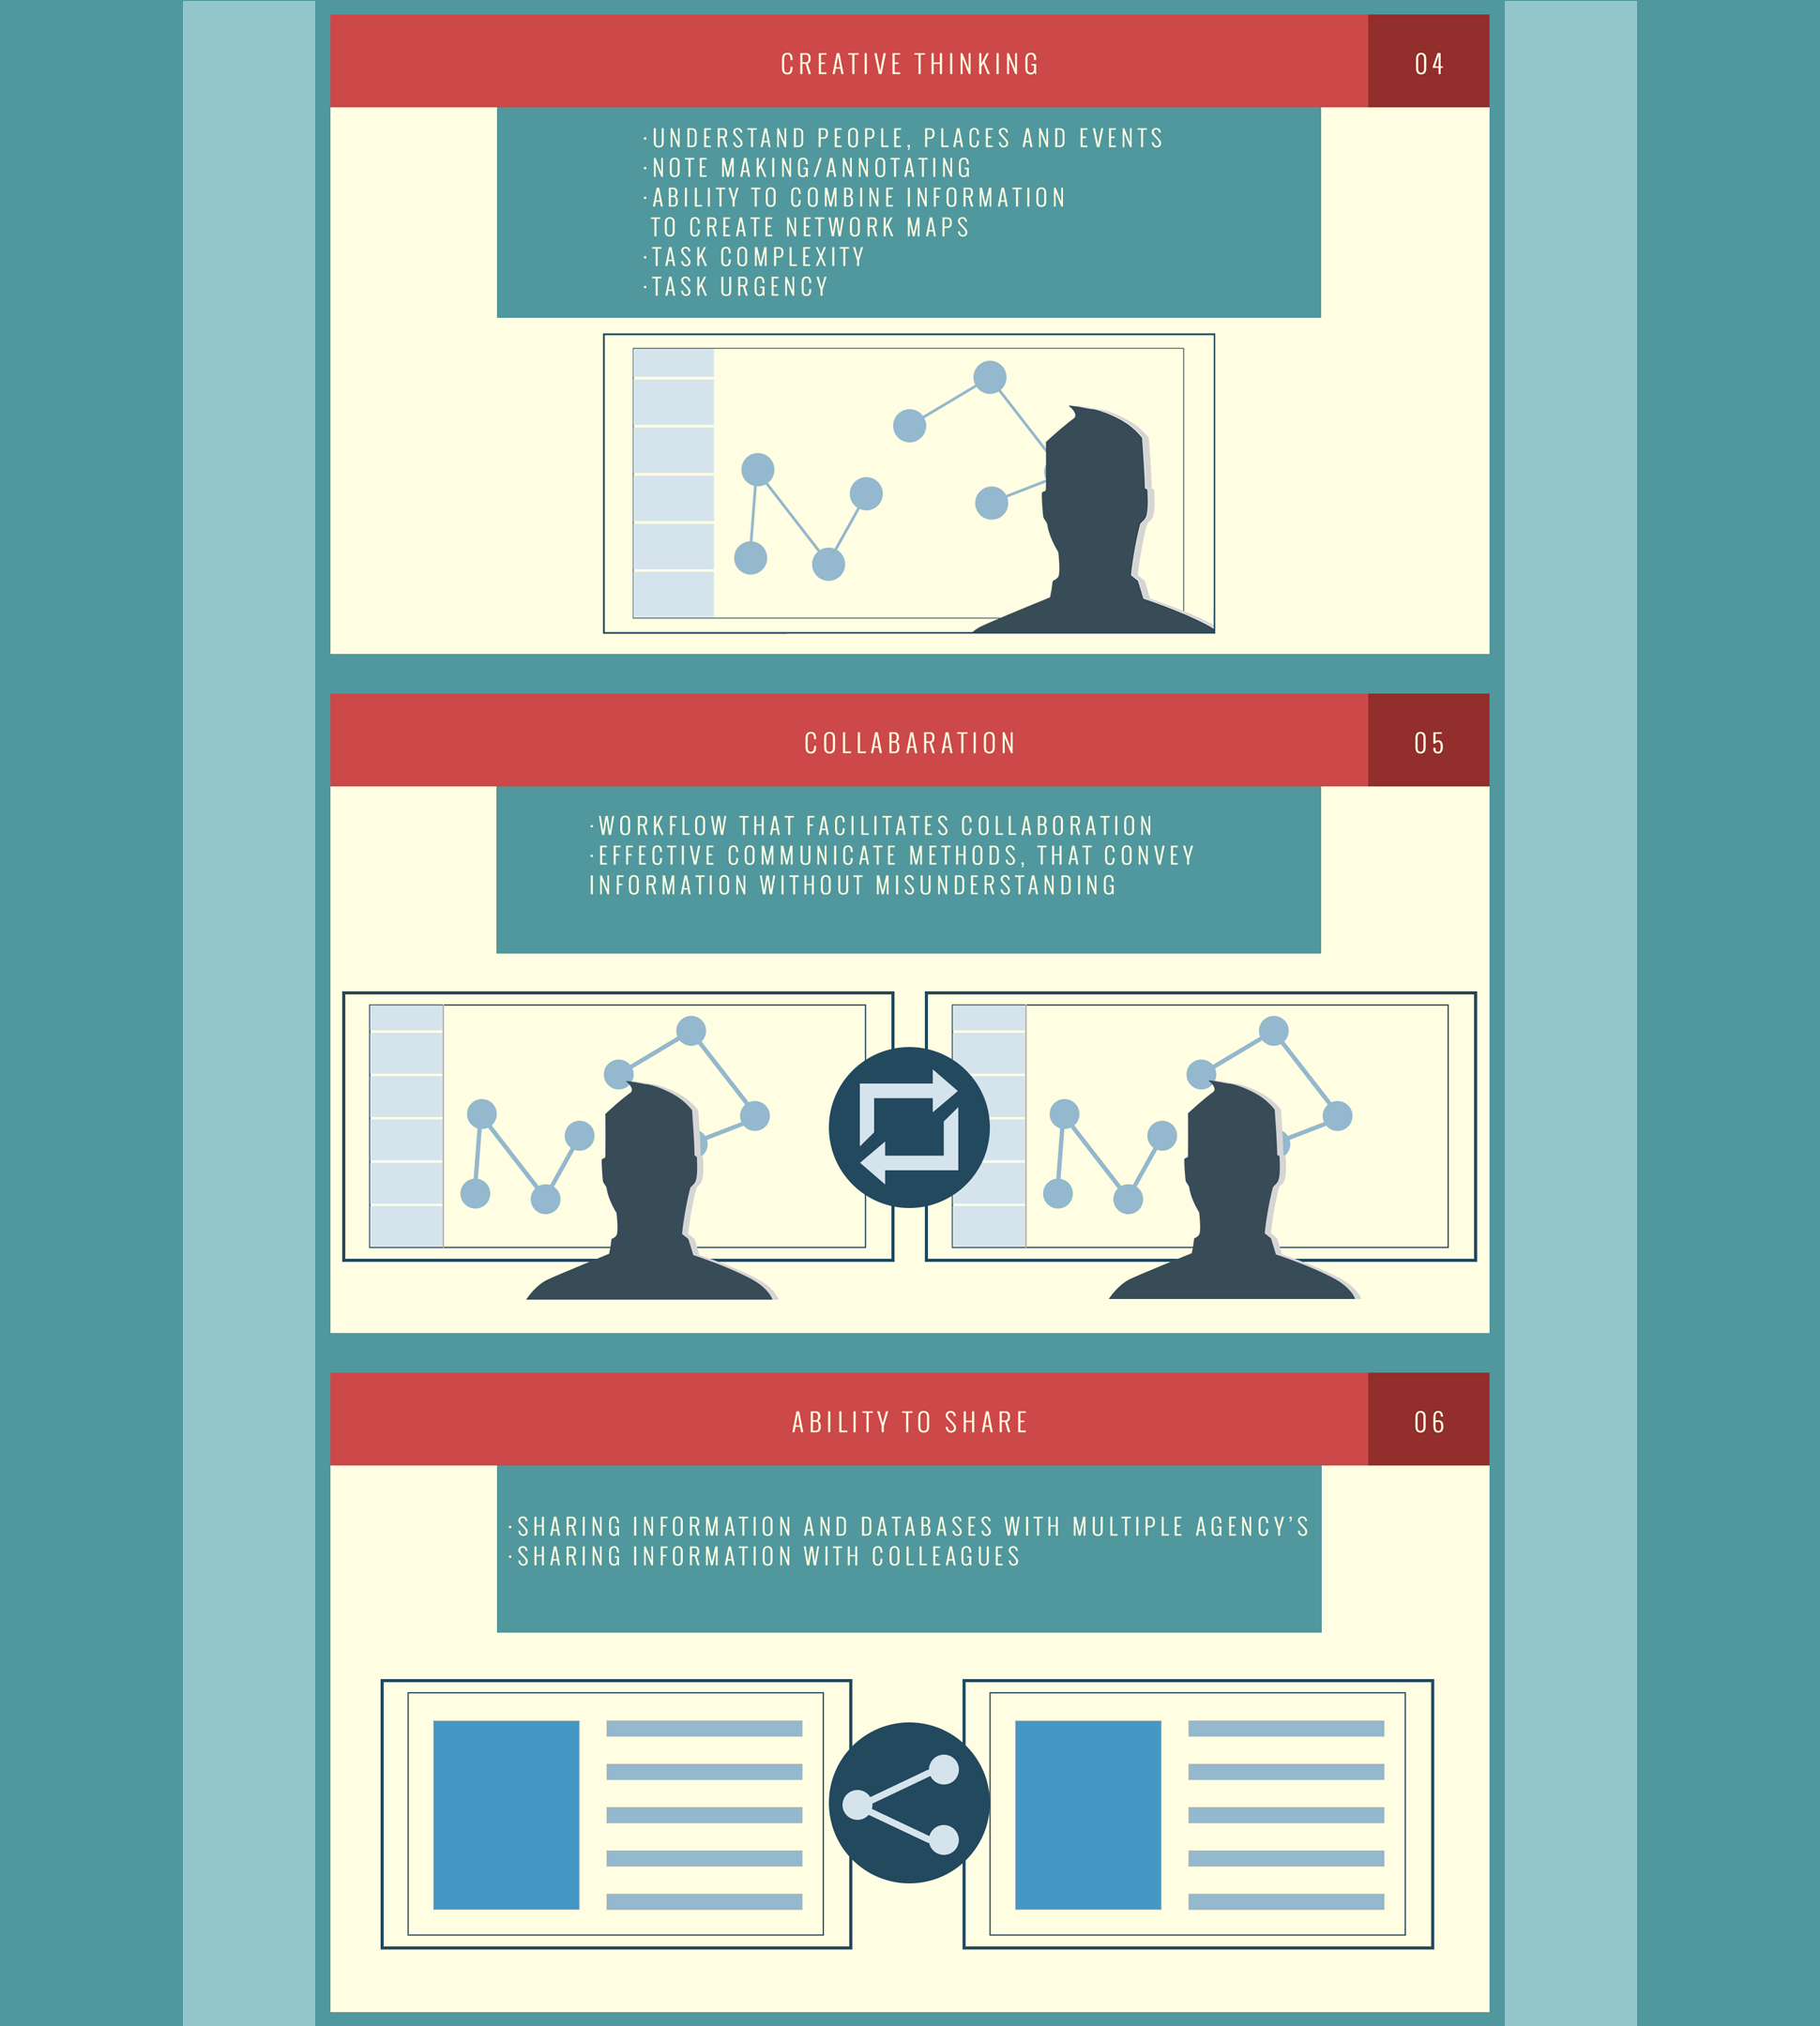
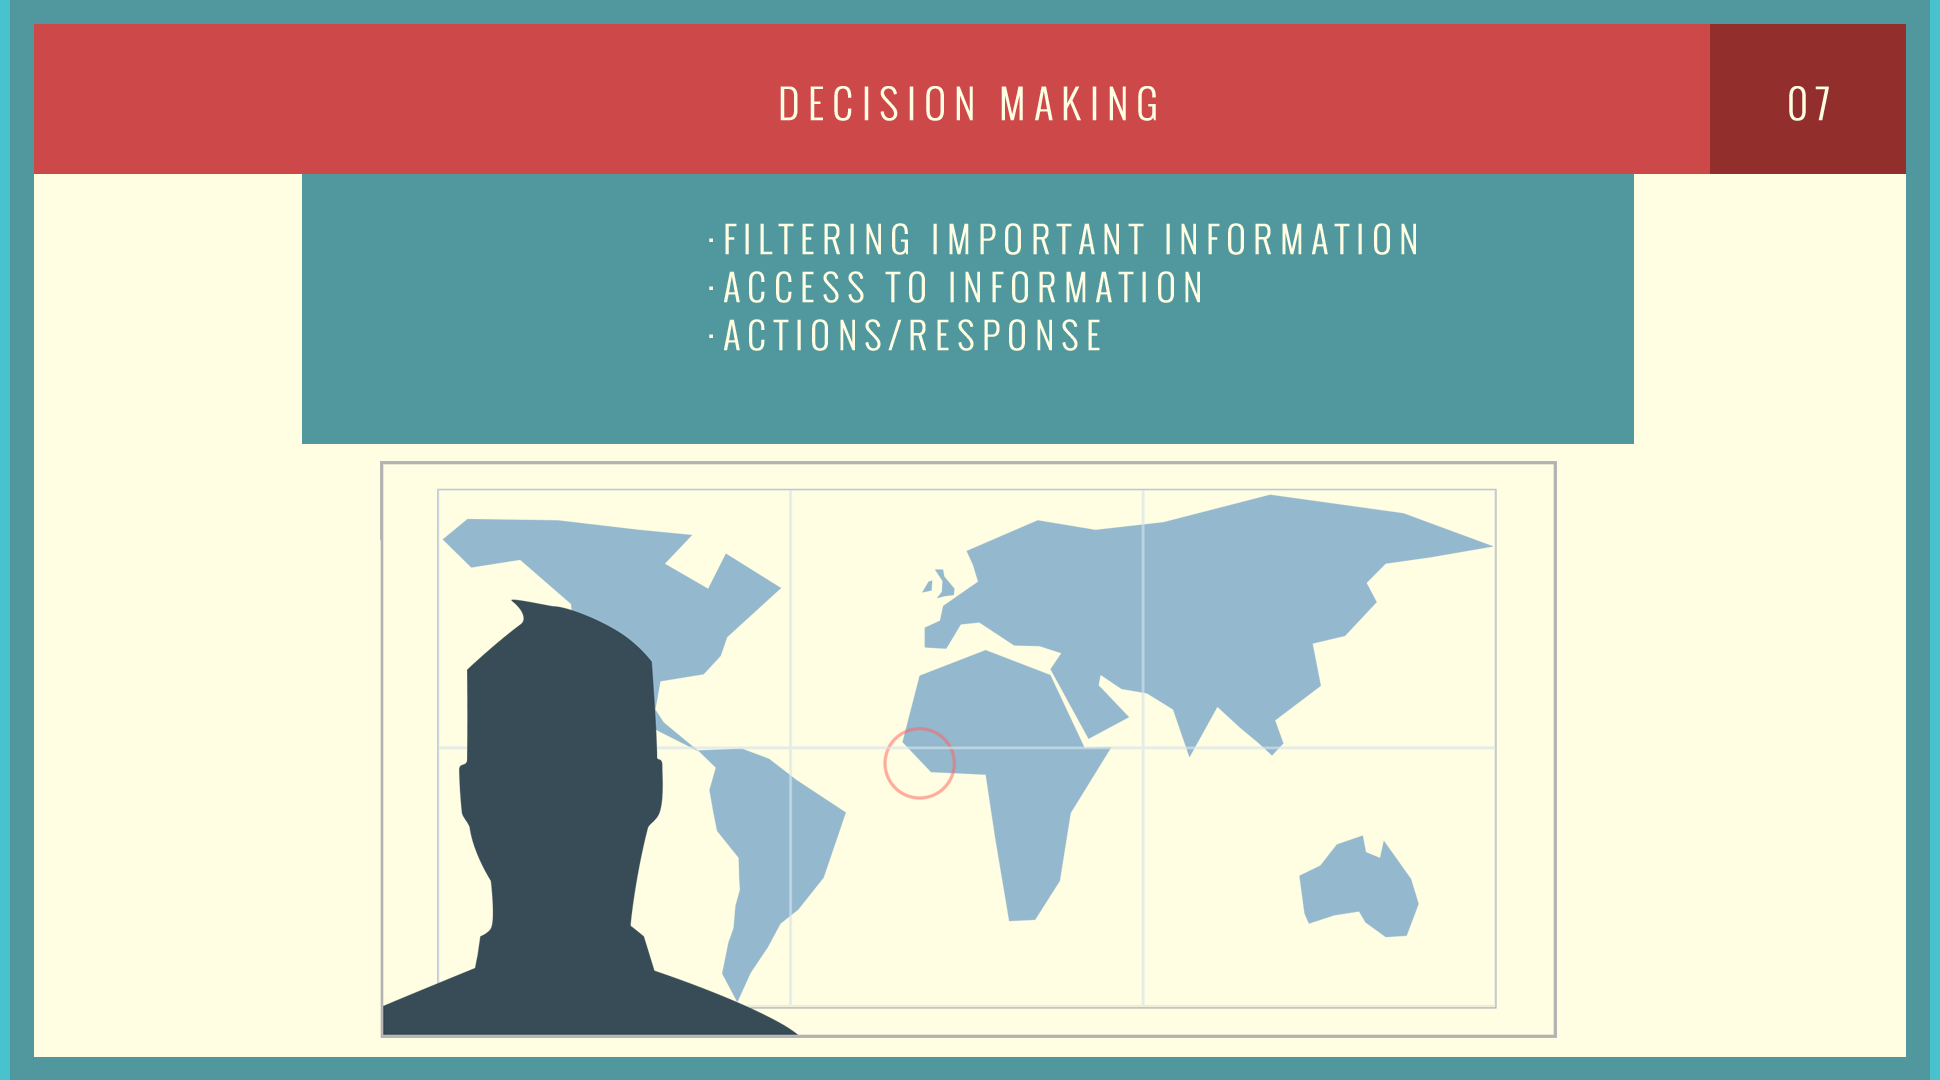
Work flow & processes
The design incorporated the following processes: data collection, analysing, visualisation, creative thinking, collaboration, ability to share and decision making.
Final Design Proposal
This is a high end concept of the OSA Wave platform, the Wave will be visualised in a 3D environment, and the information cards will be an overlay on top of the wave. The wave in the design below has a very skeuomorphic visual style, this is to reinforce the dynamic fluid oscillation of the wave idea. The user will have an organic experience when viewing the wave, it is designed to engage the user at a human level.
The size of the wave will depend on the algorithm performance output, so the higher the performance the higher the wave height. The cards will appear from the left side of the screen and move towards the right side and disappear off screen, just as explained with the ticker tape example. The size of a card will be determined by the information, and if a card requires an image.