The importance of Crossref having complete and correct metadata has increased. If a member does not submit correct or complete metadata, they are the ones that suffer the most because their content will be harder to find and less data-rich.
Crossref’s services have expanded, a single publisher’s incorrect or incomplete metadata can have a profound effect on the perceived value of Crossref’s overall services. Currently members are not aware of their metadata activity and the value it brings to the services they use. Crossref services require accurate metadata which can only be achieved by members depositing correct metadata.
Members need to be aware of their current depositing activities and the impact of inaccurate metadata.
Design research
Extensive user research was conducted for the Participations Report project. I started by understanding four areas, which included User engagement mechanics, behaviour change, semiotics, gamification, customisation and ownership. To evaluate how best to approach the design, create awareness and change the user's behaviours to deposit better data with Crossref.
Gamification
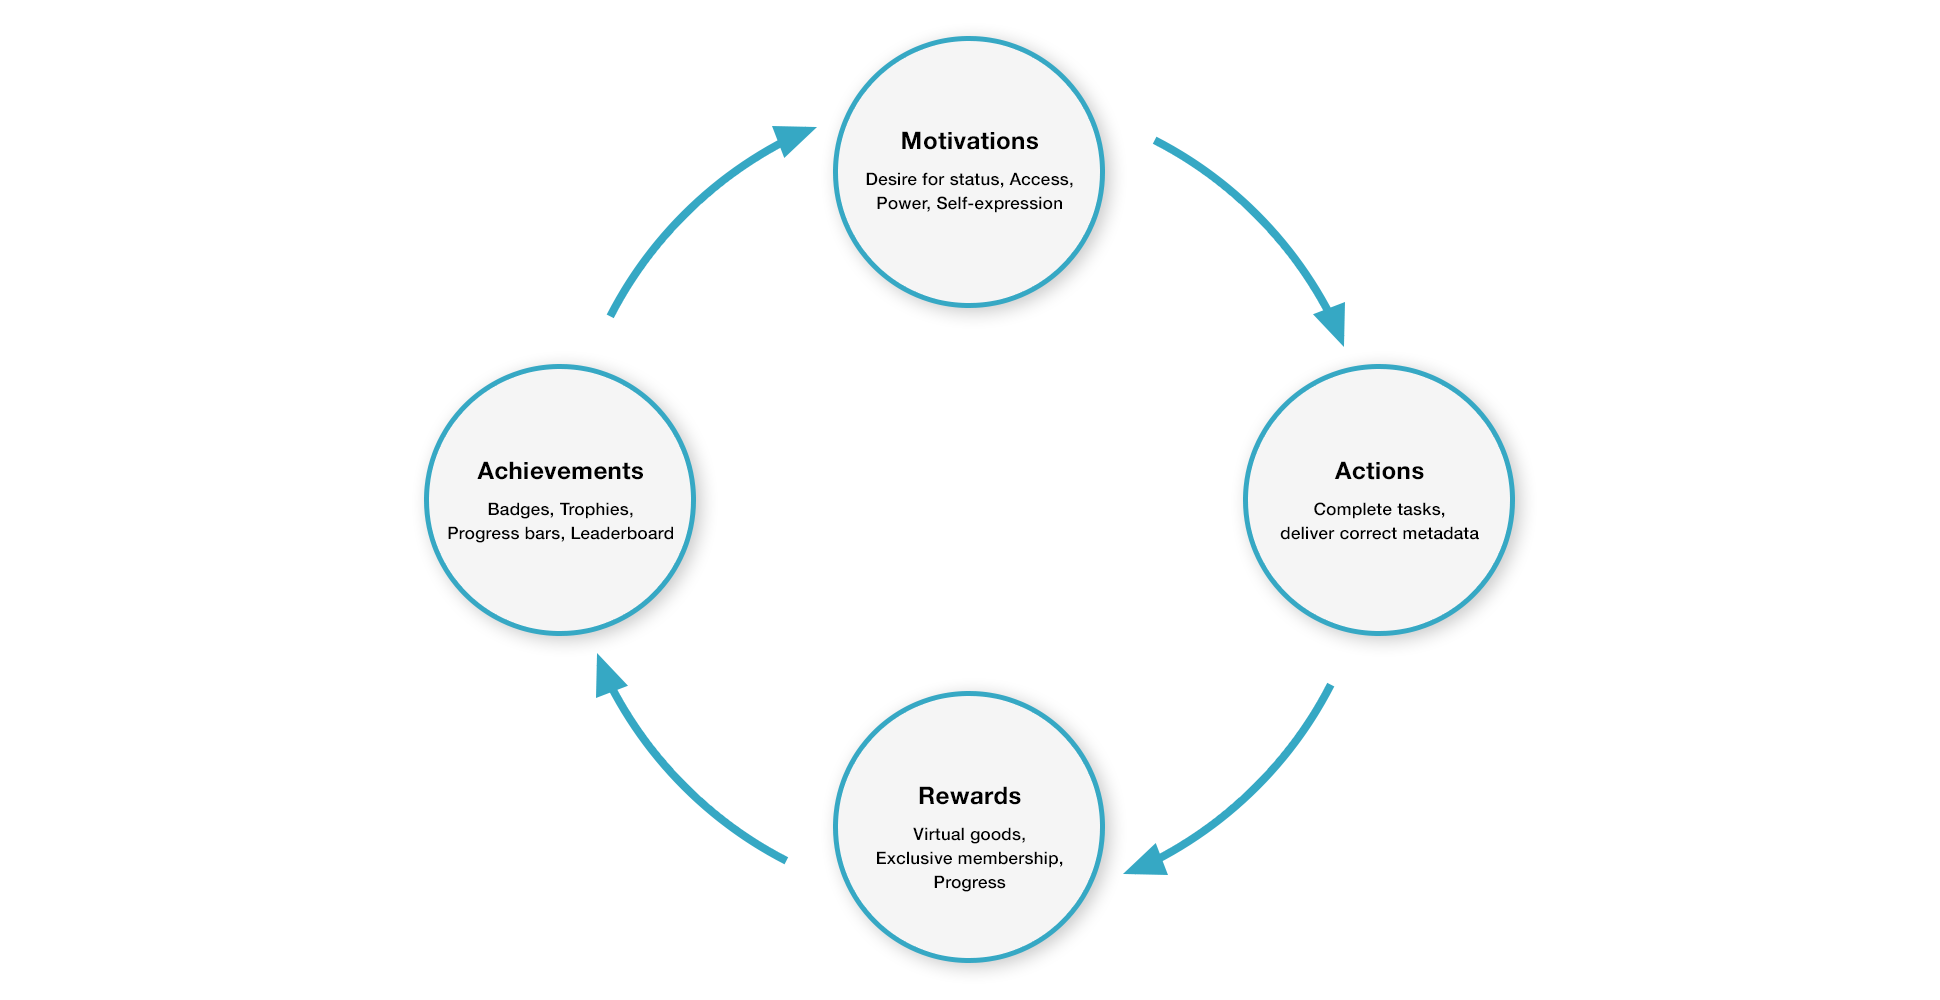
I started design research into how gamification could help promote better metadata depositing. The concept of gamification of a UI uses game design elements and mechanics in non-game contexts to motivate and engage user to complete tasks or achieve goals.
The following area of gamification were explored: engagement mechanics, badges & achievements and tier systems.
User engagement mechanics
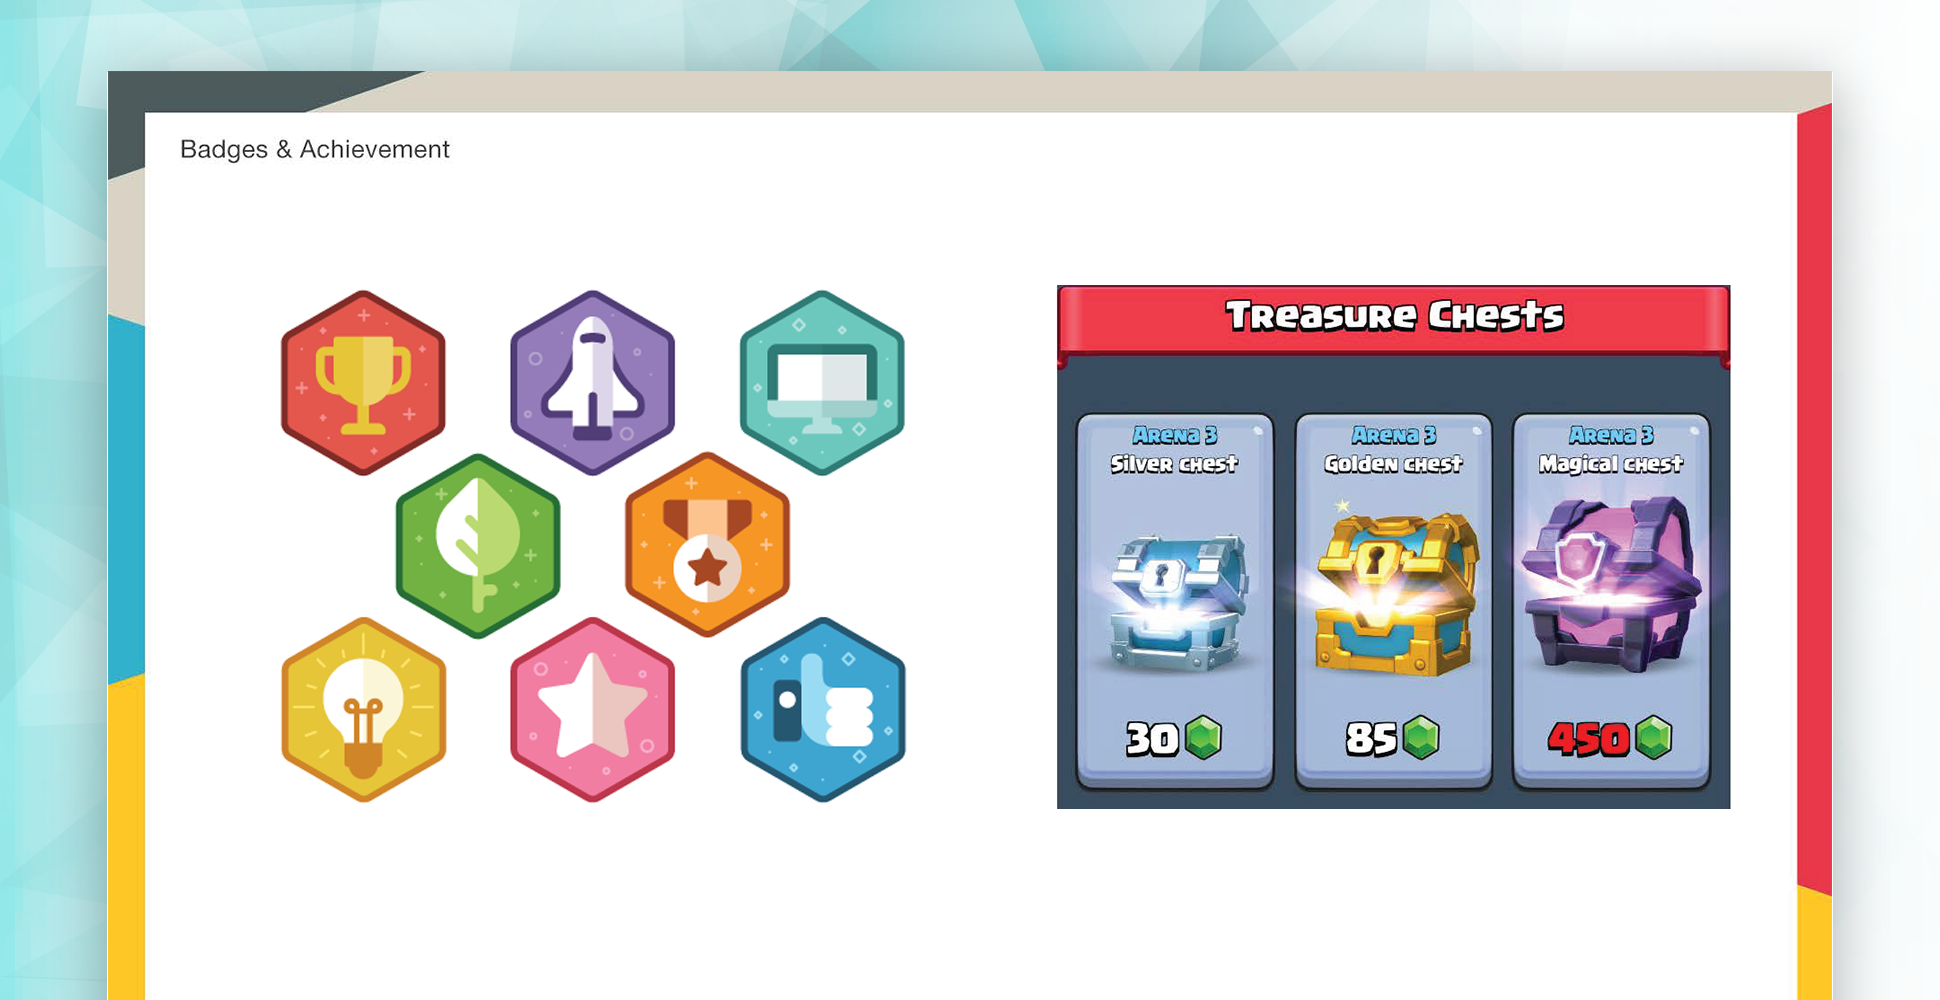
Badges & achievements
Gamification badges are graphical rewards or achievements that are awarded to users for completing certain tasks or achieving specific goals. They are commonly represented as icons that are displayed on a user's profile or dashboard, this helps to highlight the user’s status and indicates their level of achievement or progress.
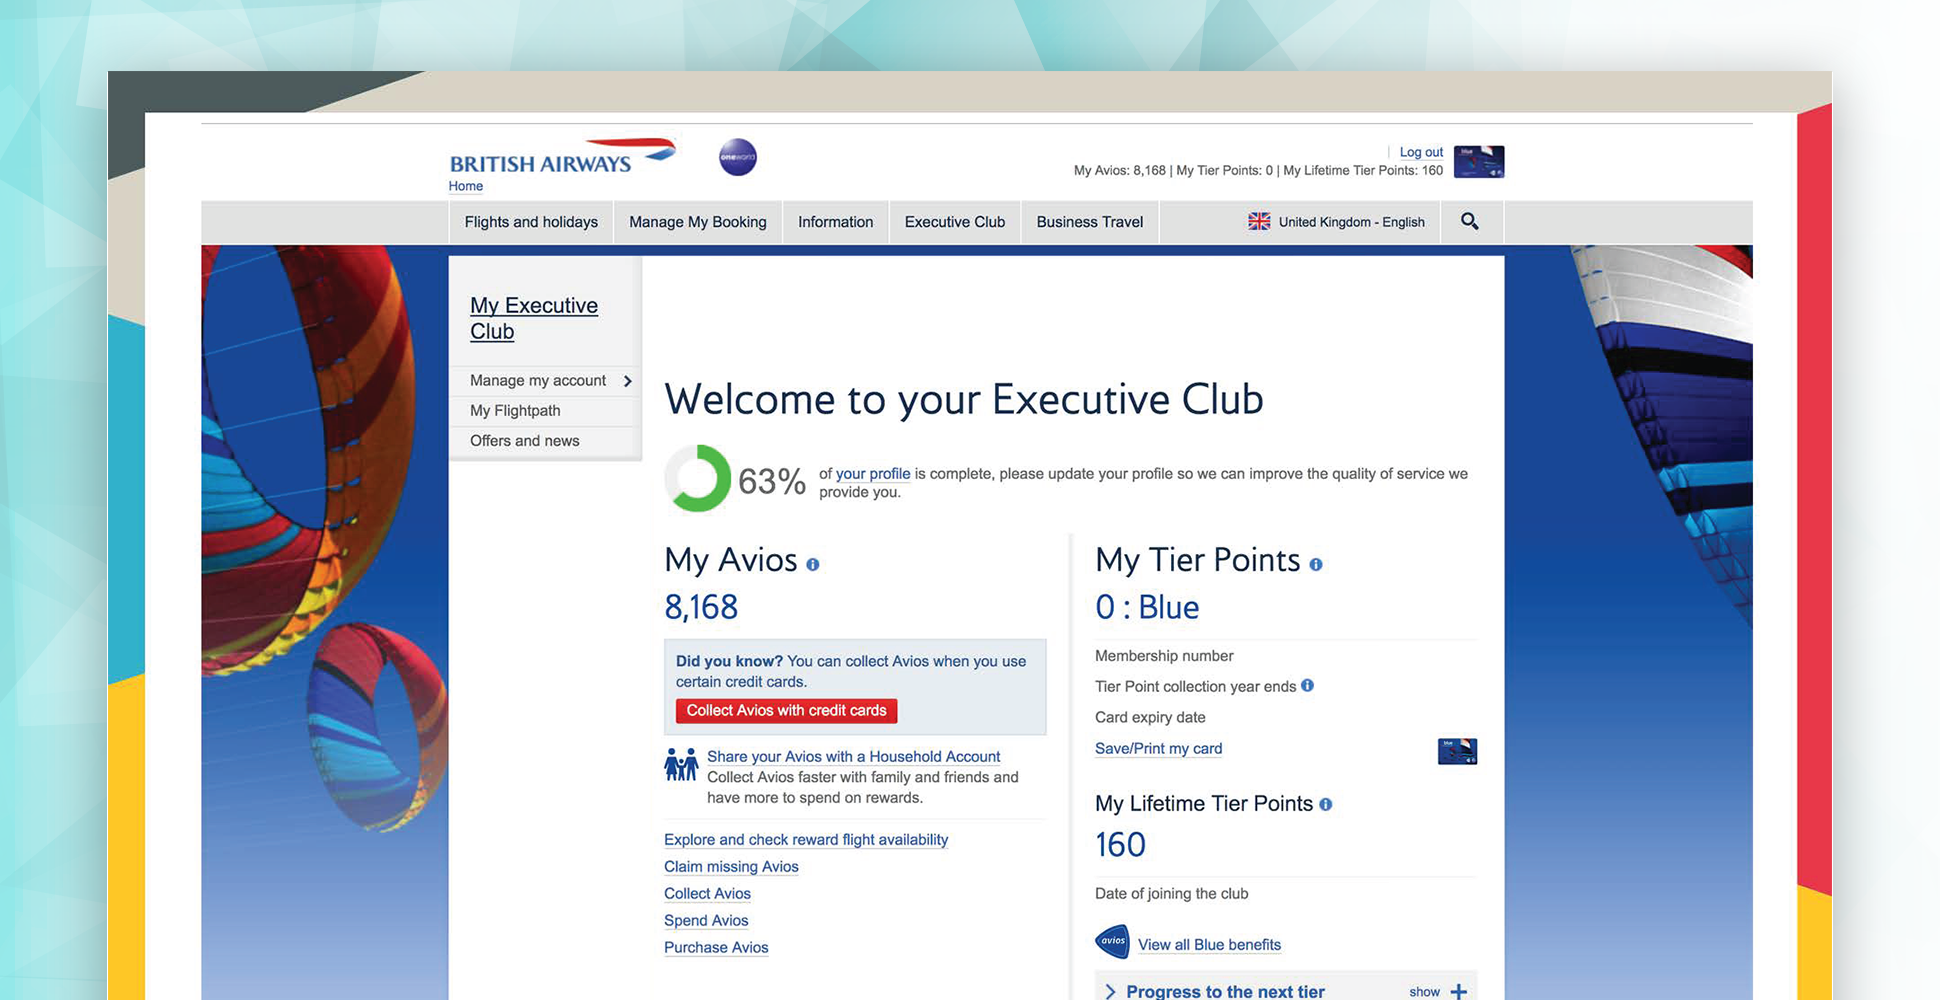
Tier Systems
The users progress within a system can be represented as tiere’s, in which users are grouped into different levels or tiers based on their level of engagement, activity or progress. Each tier represents a different level of achievement, and higher tiers indicate a greater levels of achievement.
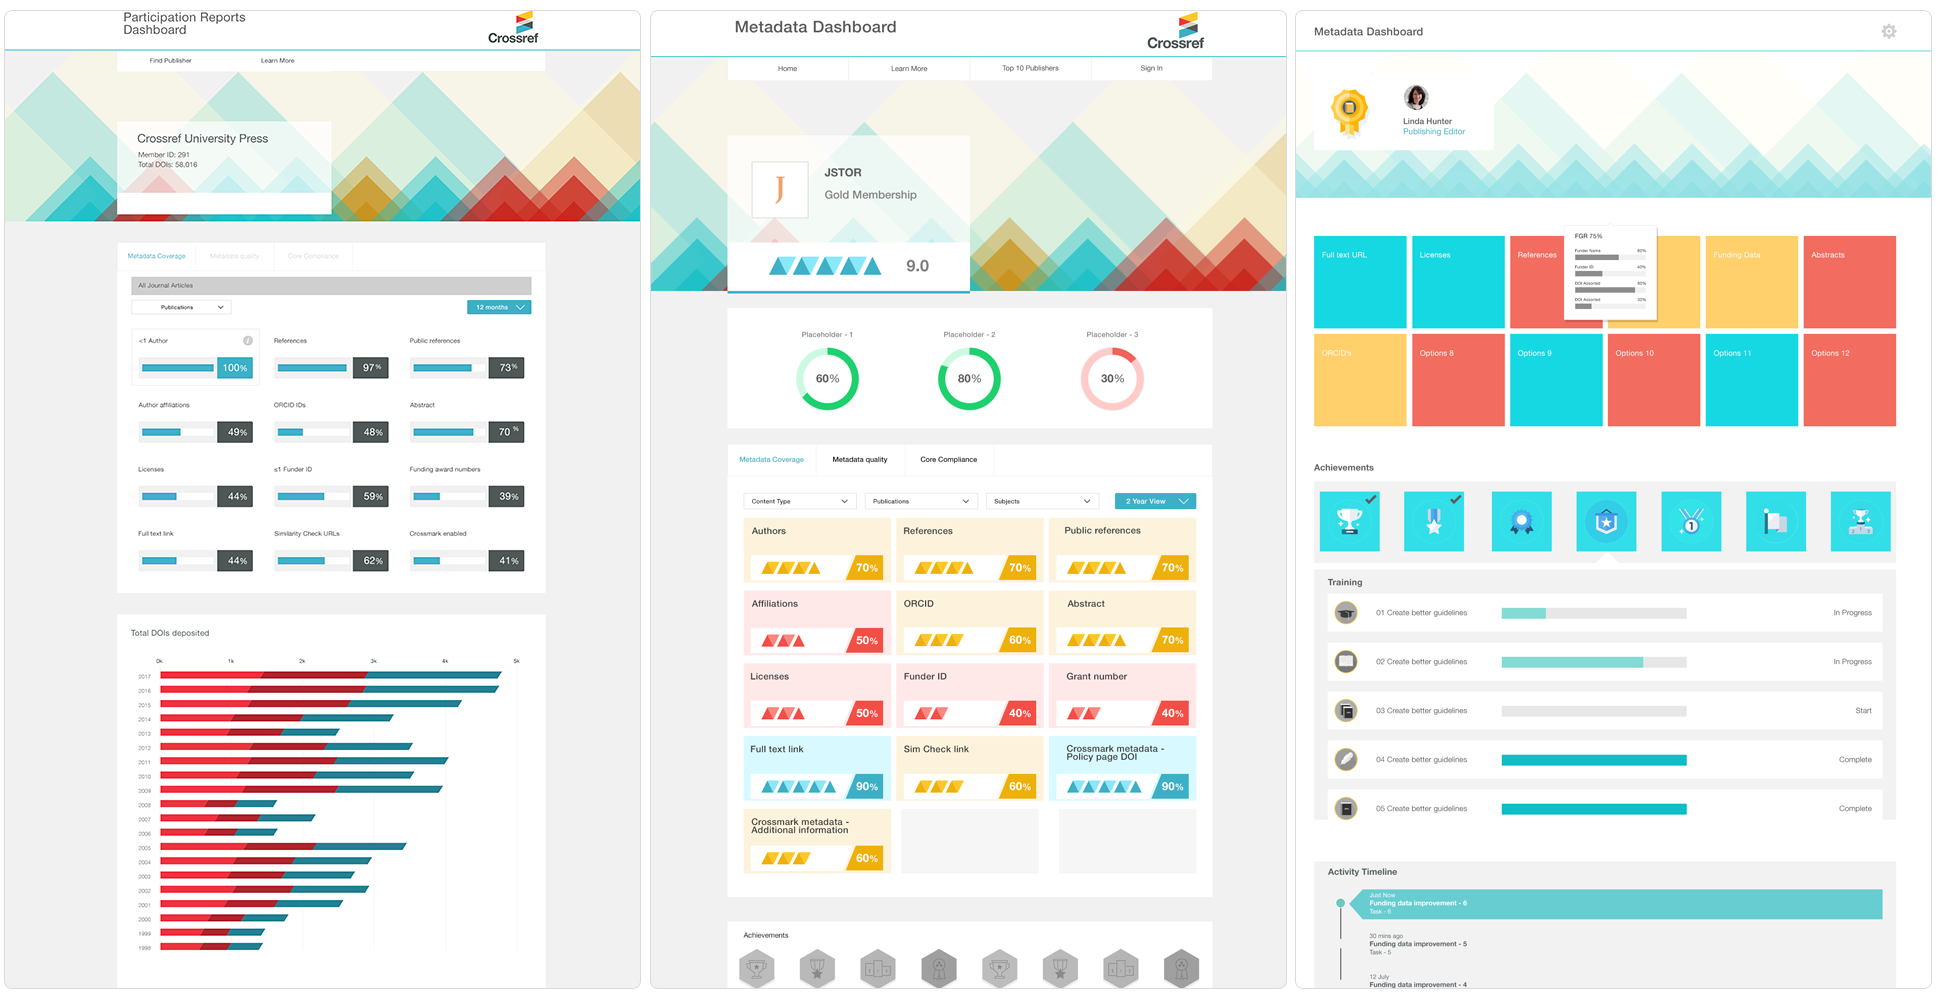
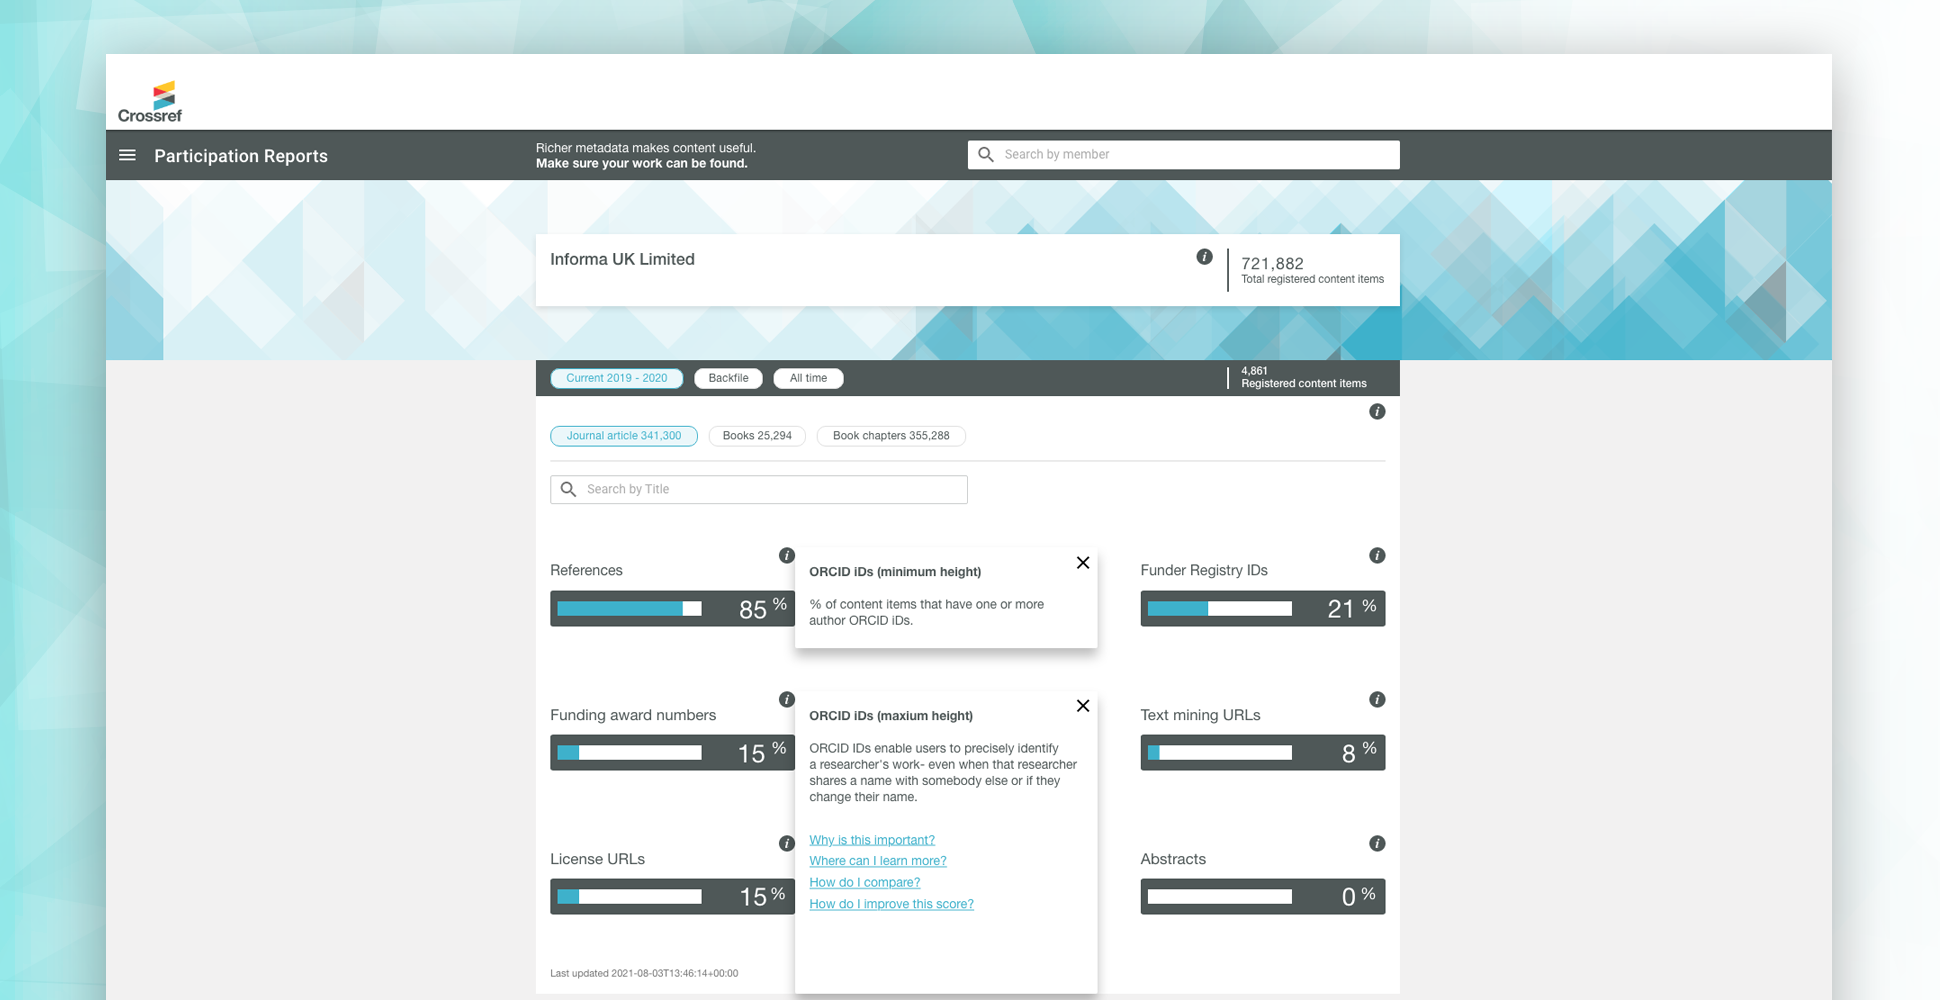
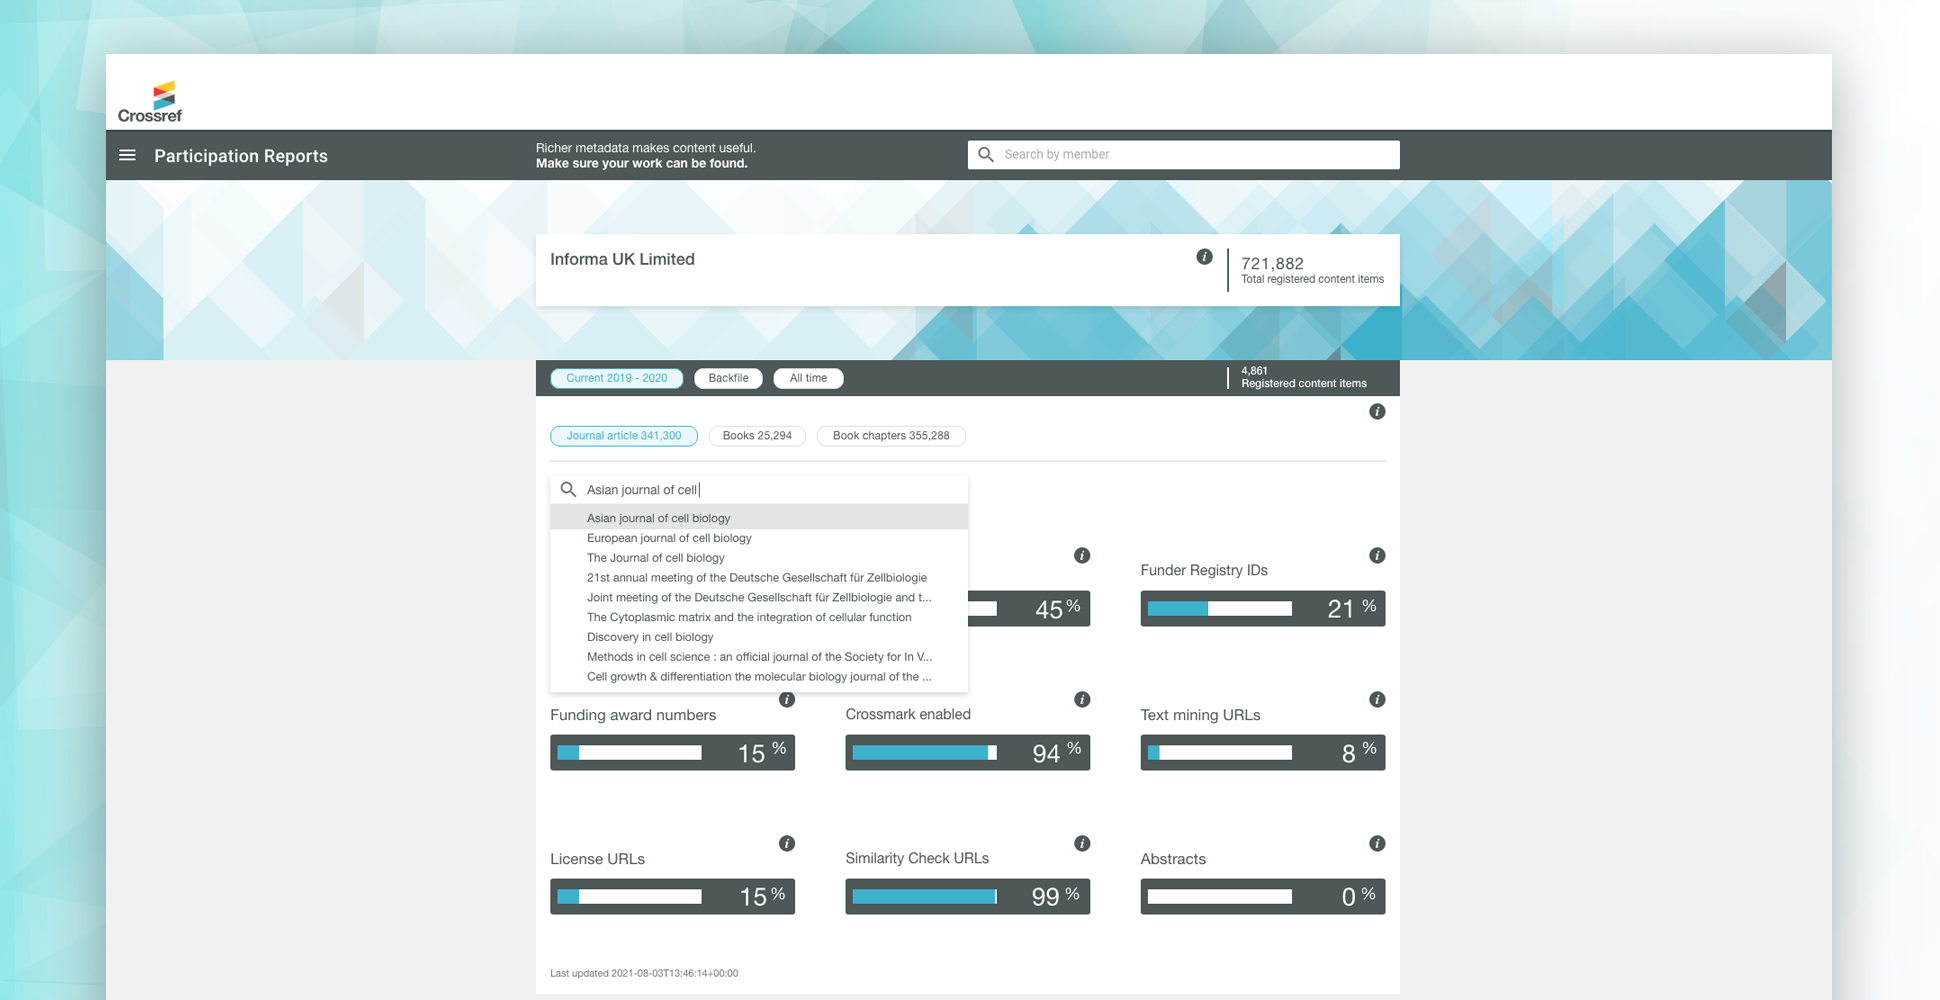
When starting the design exploration phase of the project I made sure to display all member metadata and values to describe how well they are performing. Allow anyone to search for a member to help members compare against each other. And guide members and help further improvement of their metadata.
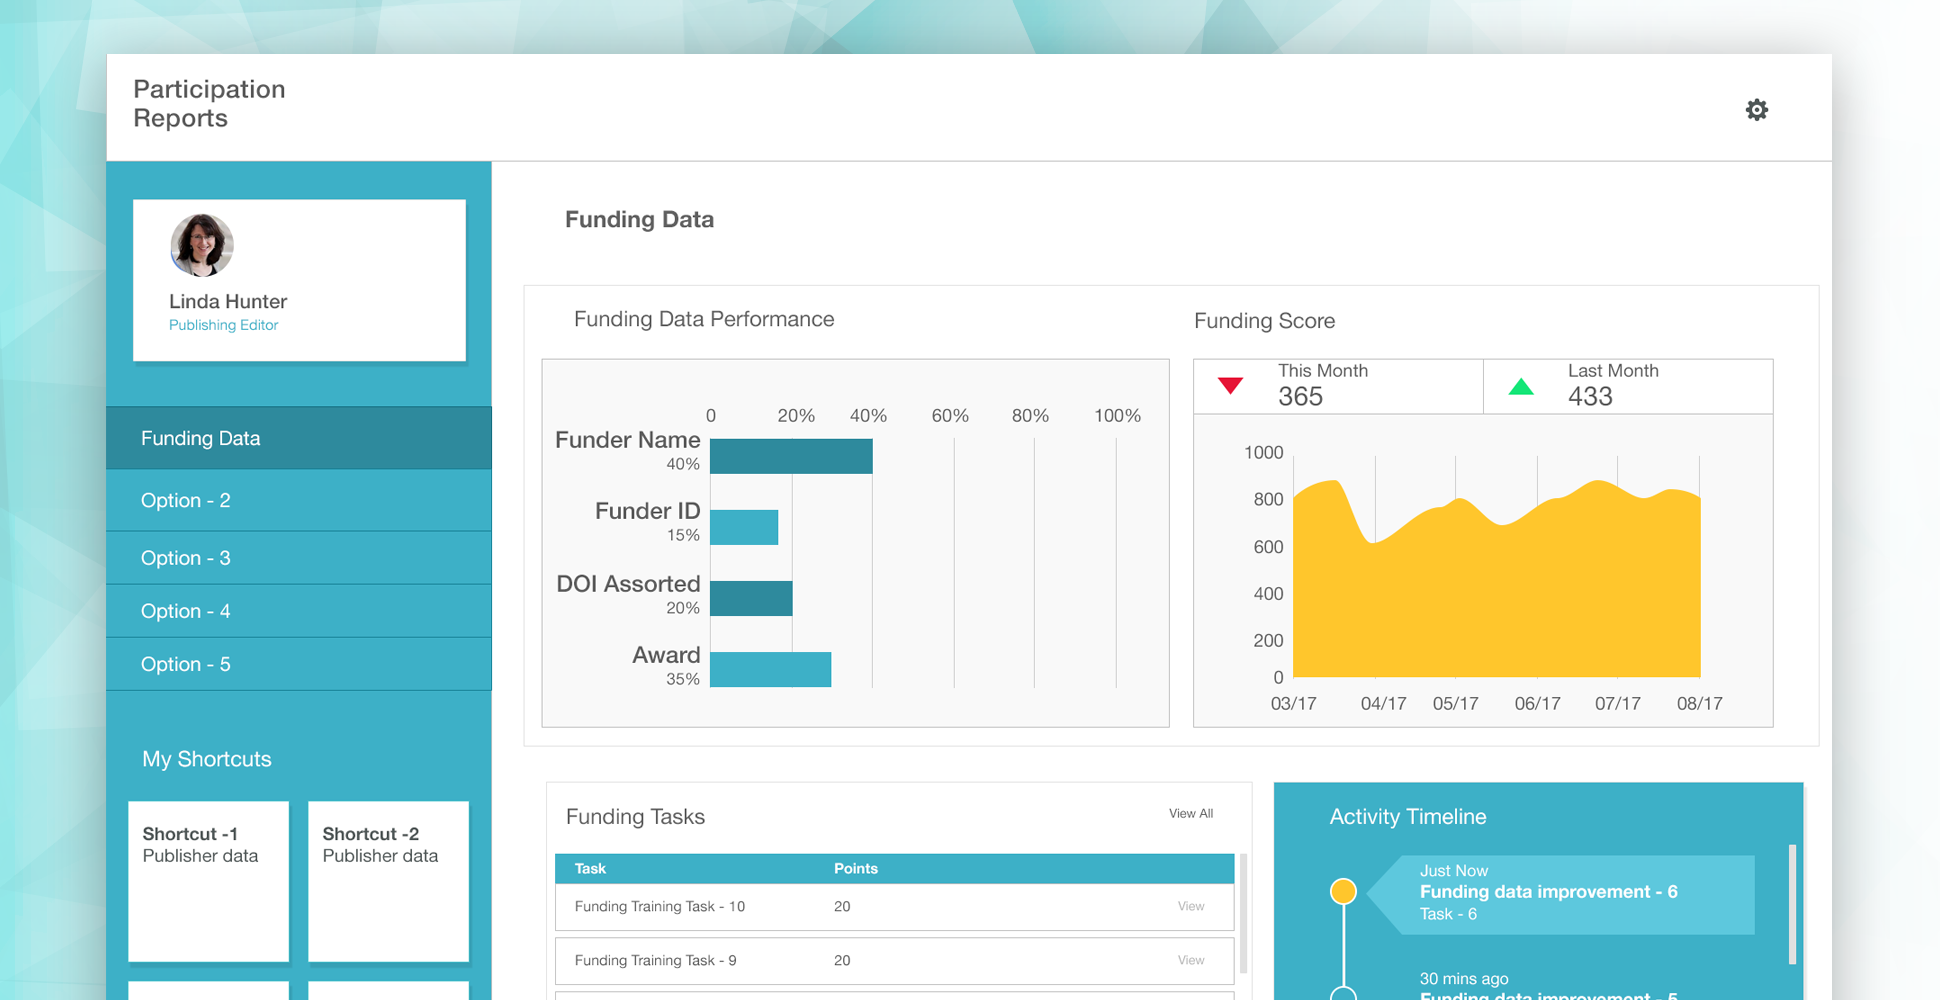
I explored multiple design concepts and experimented with a variety of layouts, colours and data visualisation charts. The initial designs were heavily influenced by gamification to try and push the limits of the designs.
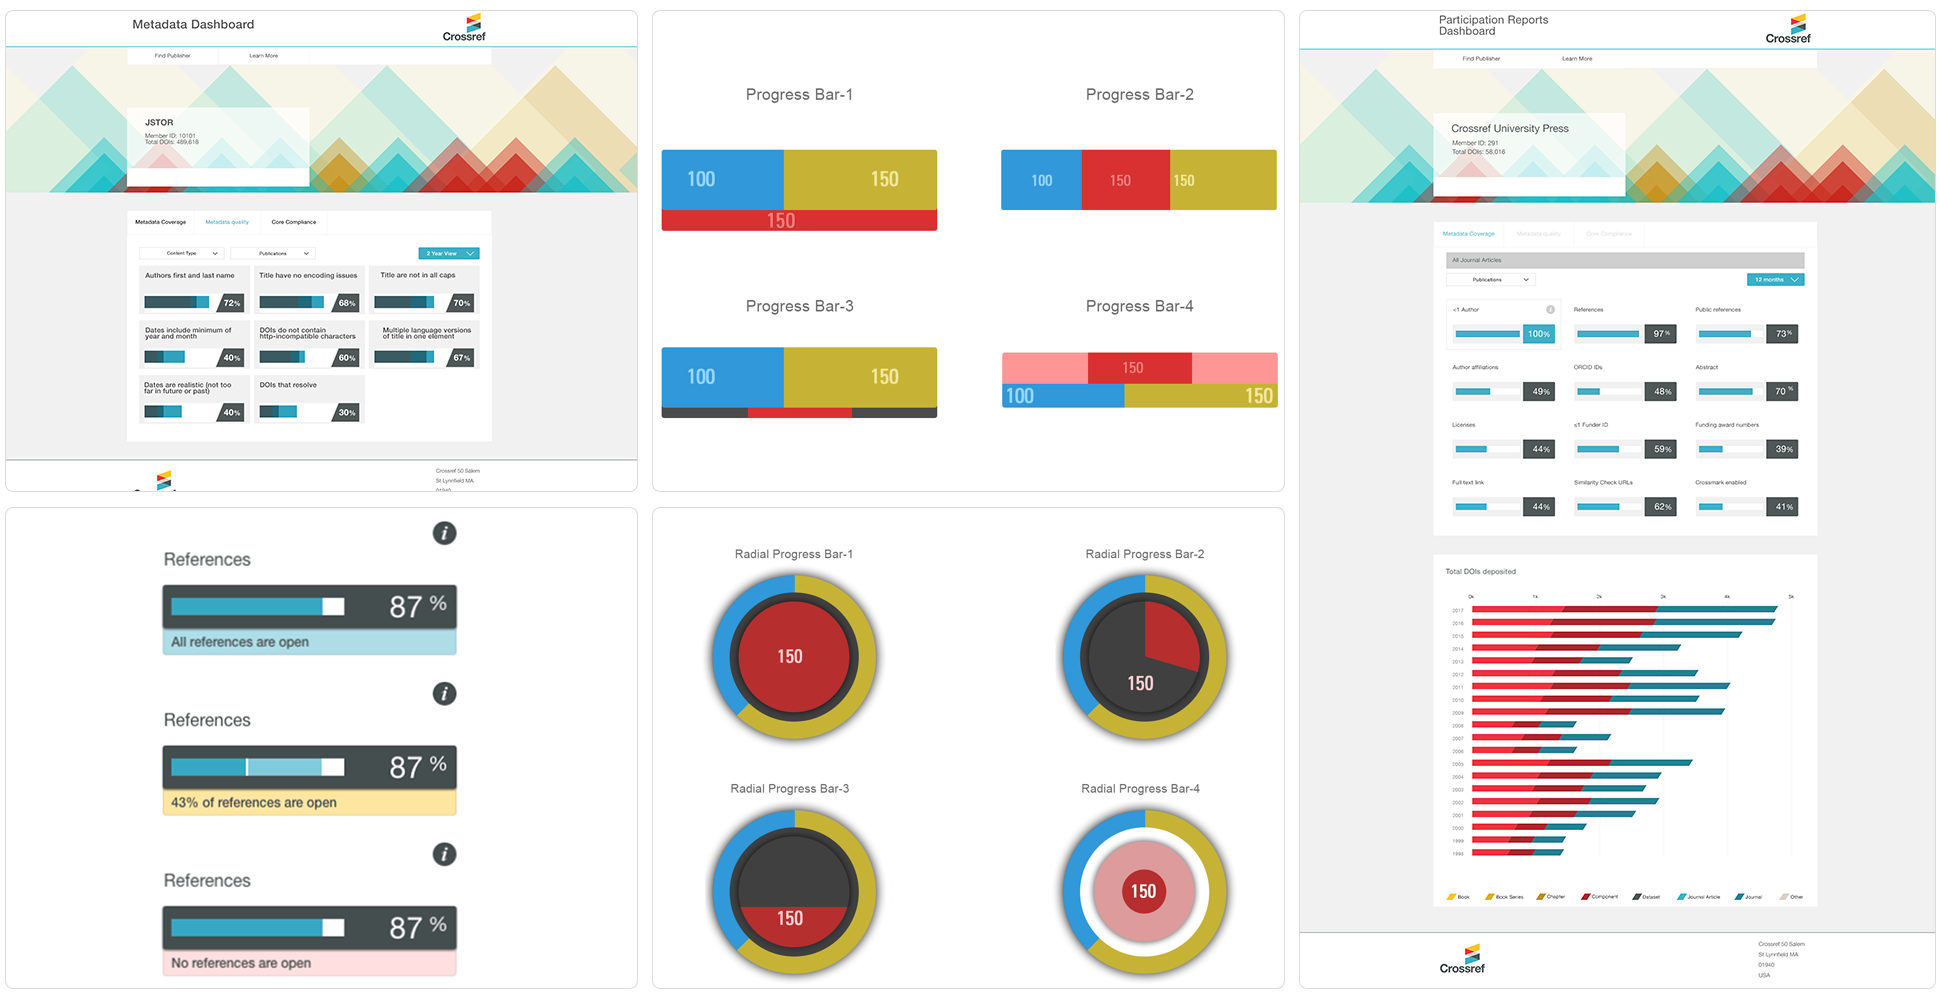
I also conducted design exploration into progress bars and radial readouts, to evaluate which visualisation best represented the data.
To help progress the design further and validate our design assumption usability testing sessions were conducted. This helped to highlight user painpoints and collect vital feedback.
Creating a usability test plan
A usability test plan was created to help define how the test sessions would be performed. The testing sessions invites were sent out to members and I acquired 9 testing candidates for usability testing.
Questions & tasks
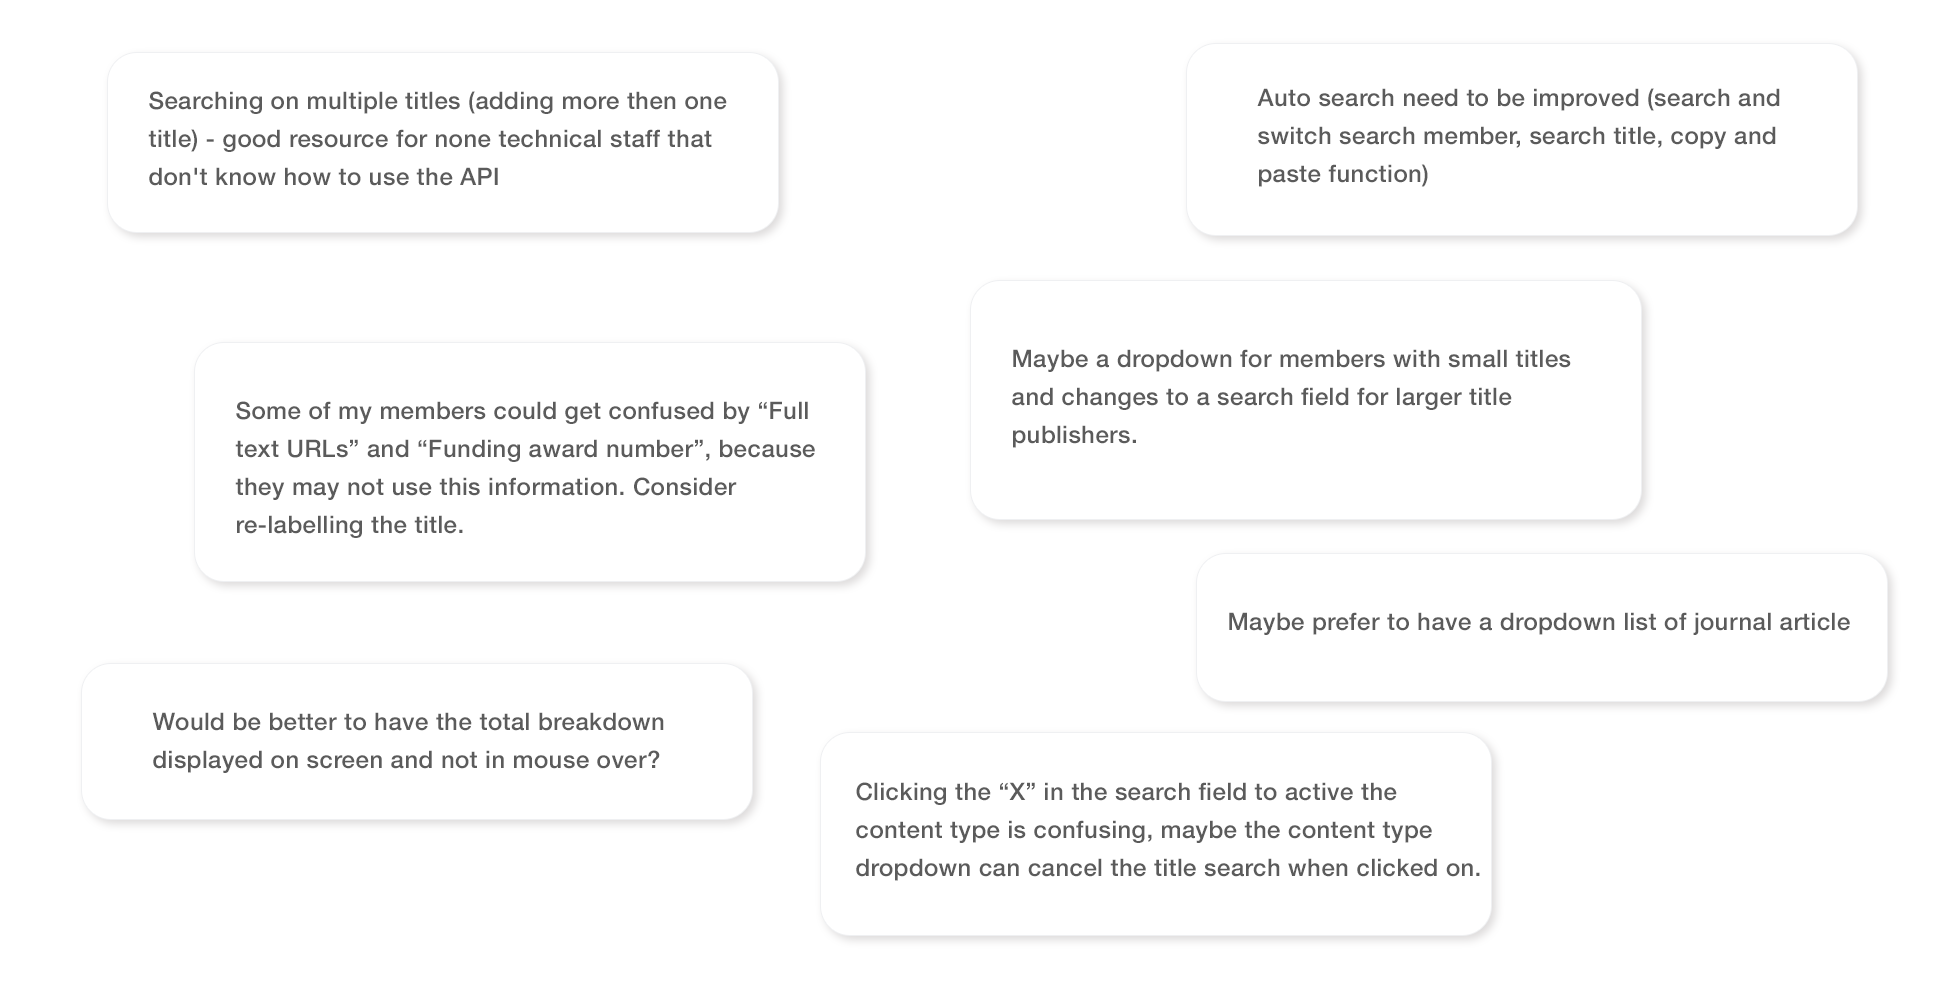
A defined list of questions tailored towards the user were used to collect feedback points as each user is given a task to complete using the clickable prototype.They are also questioned about how they are perceiving the experience.
Feedback analysis
Every feedback point was reviewed to establish further design updates and improvements. Which helped to establish user painpoint and next steps for further design thinking and investigation.
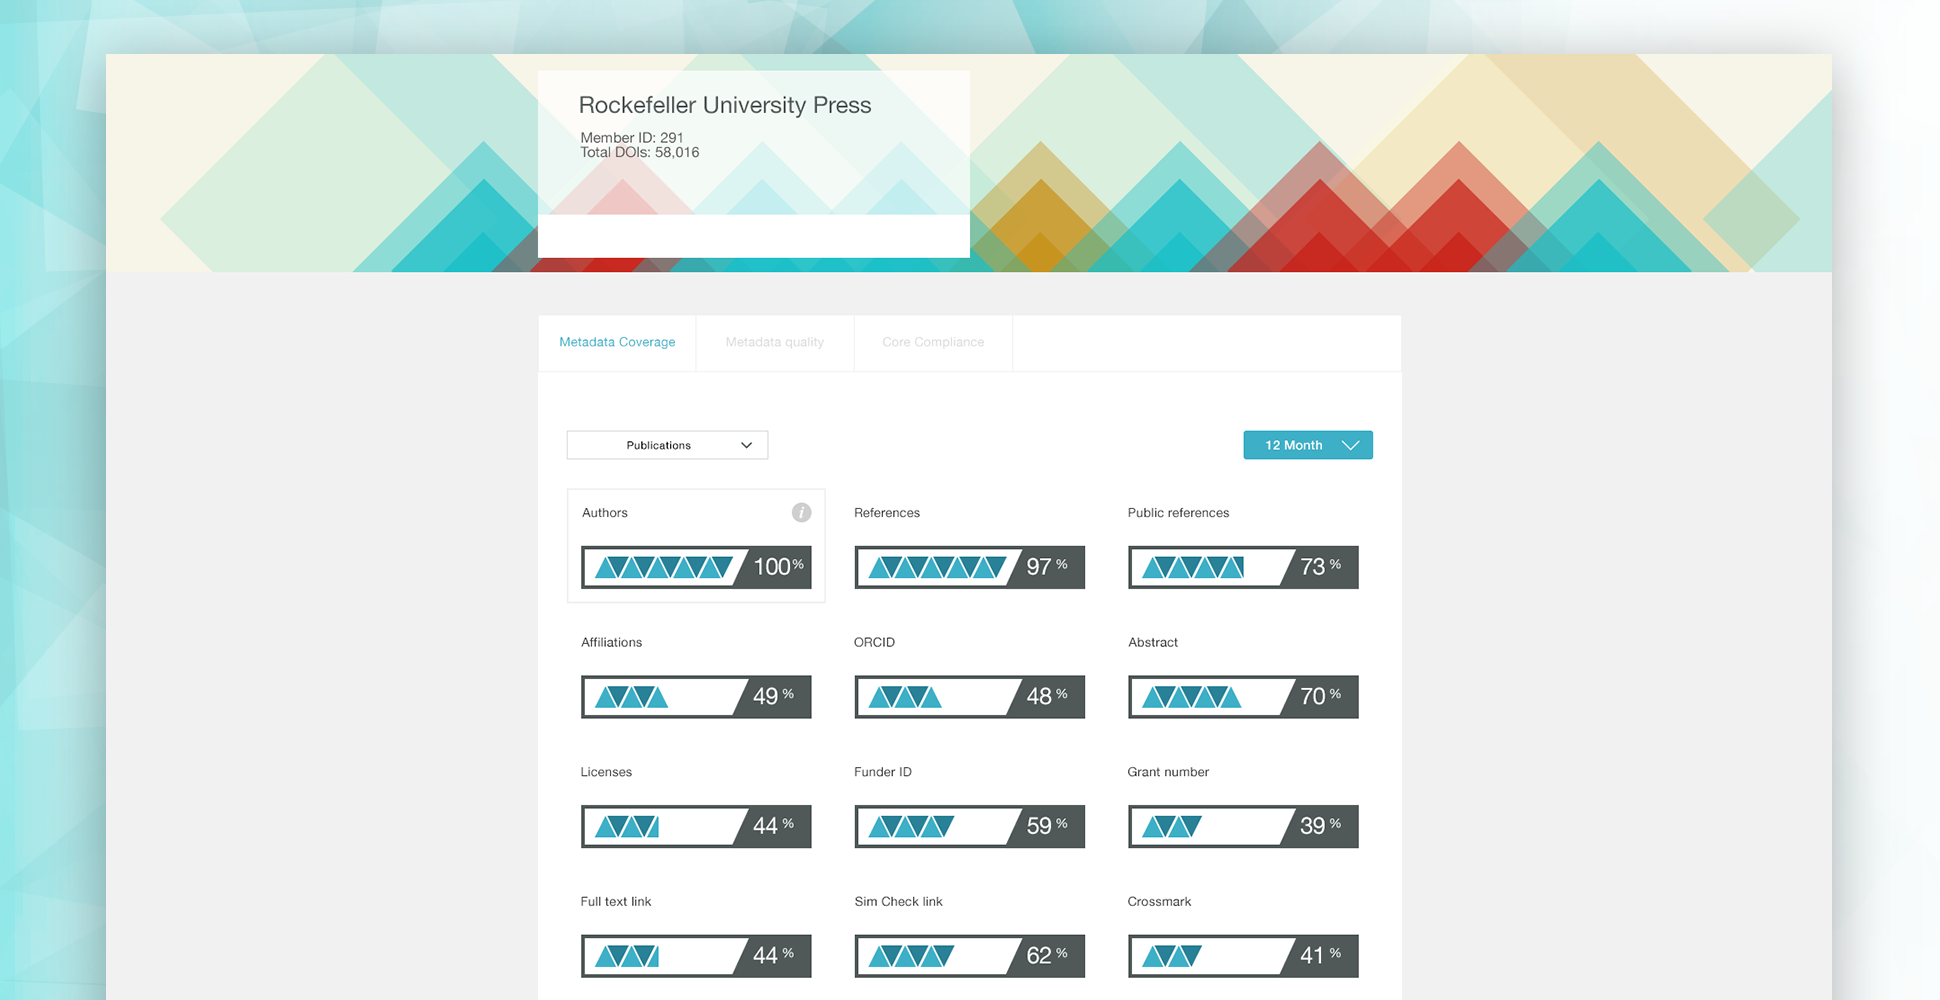
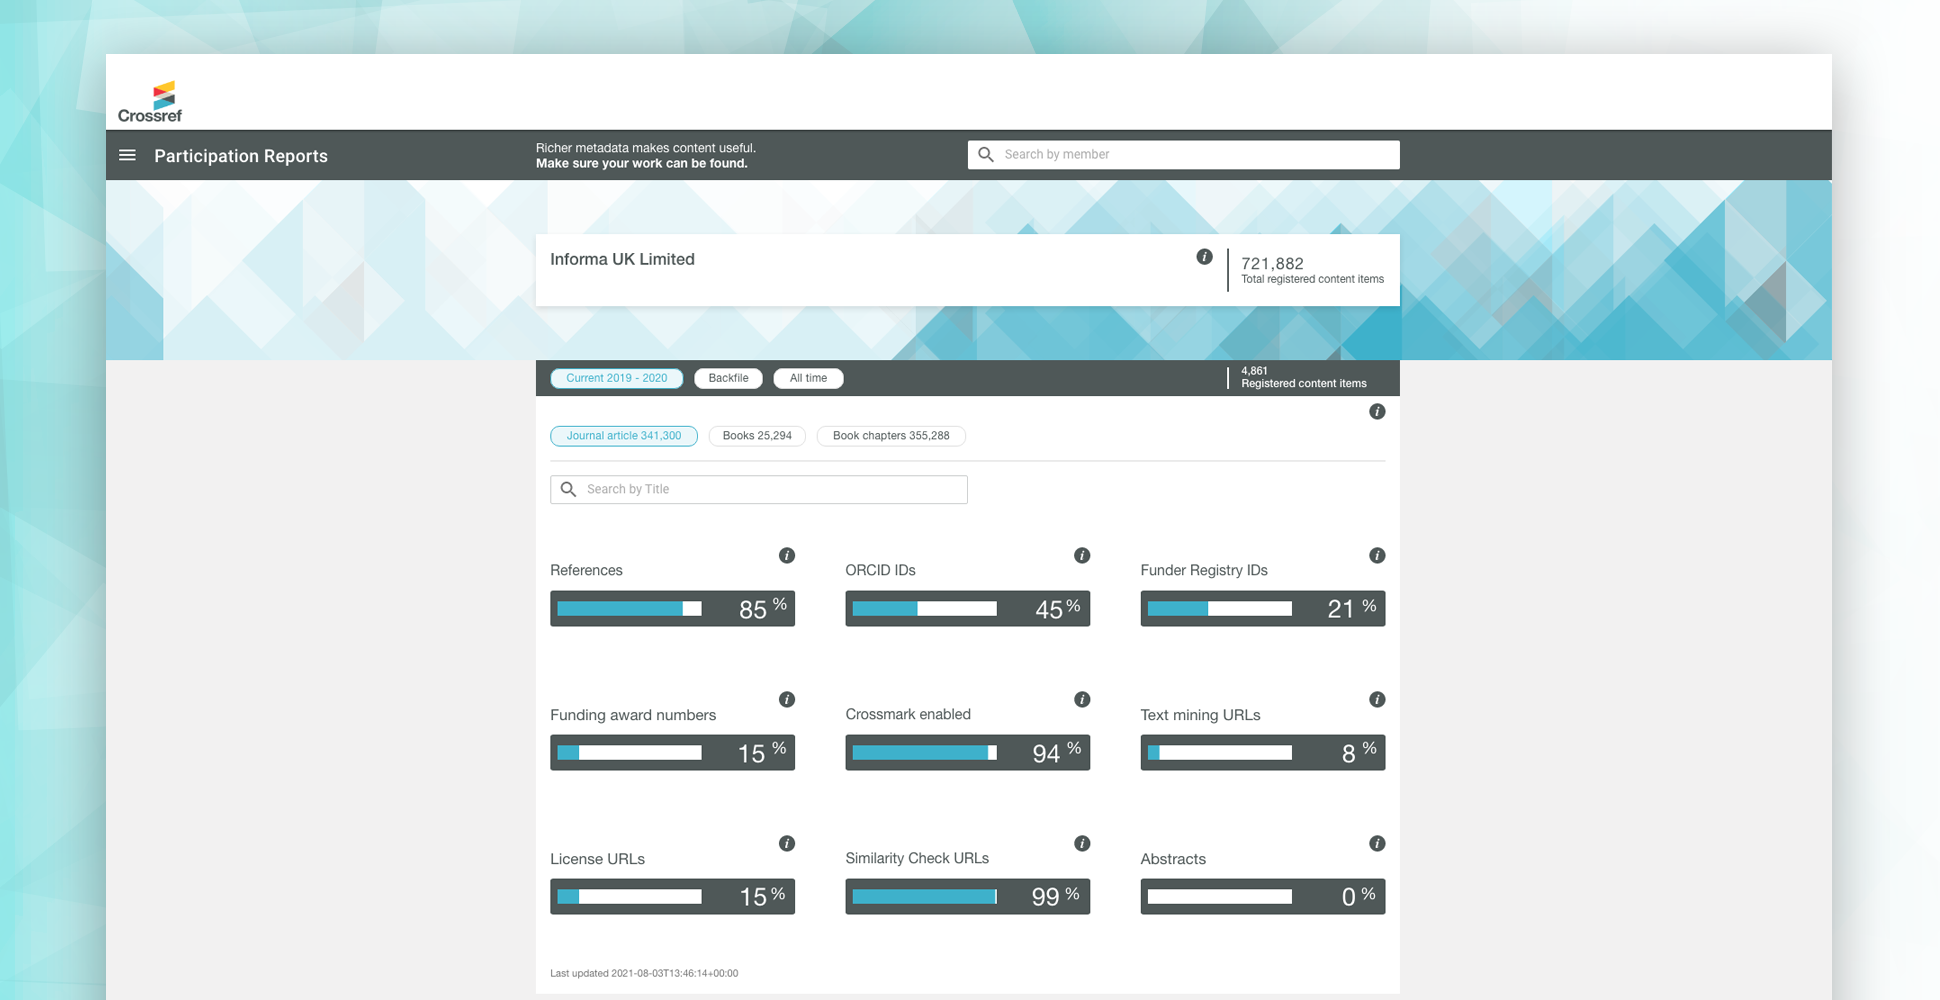
After multiple rounds of design exploration, the design converged in a direction that was easy to visually read and functionally simply to use. The designs were very well received by staff and members. Crossref Participation Reports design included some key visual feature:
• Add state behaviour to the progress bar components.
• Incorporate Crossref brand colours to the design to create visual consistency.
• Maintaining visual hierarchy with the aim to make the data standout.
• Sensitivity towards member perception of the data
The Participation Report project has created a massive impact in helping members understand which areas of their metadata need further improvement.